Article Text

Abstract
Background Type 2 diabetes (T2D) is a chronic metabolic disorder with high comorbidity with mental disorders. The genetic links between attention-deficit/hyperactivity disorder (ADHD) and T2D have yet to be elucidated.
Aims We aim to assess shared genetics and potential associations between ADHD and T2D.
Methods We performed genetic correlation, two-sample Mendelian randomisation and polygenic overlap analyses between ADHD and T2D. The genome-wide association study (GWAS) summary results of T2D (80 154 cases and 853 816 controls), ADHD2019 (20 183 cases and 35 191 controls from the 2019 GWAS ADHD dataset) and ADHD2022 (38 691 cases and 275 986 controls from the 2022 GWAS ADHD dataset) were used for the analyses. The T2D dataset was obtained from the DIAGRAM Consortium. The ADHD datasets were obtained from the Psychiatric Genomics Consortium. We compared genome-wide association signals to reveal shared genetic variation between T2D and ADHD using the larger ADHD2022 dataset. Moreover, molecular pathways were constructed based on large-scale literature data to understand the connection between ADHD and T2D.
Results T2D has positive genetic correlations with ADHD2019 (rg=0.33) and ADHD2022 (rg=0.31). Genetic liability to ADHD2019 was associated with an increased risk for T2D (odds ratio (OR): 1.30, p<0.001), while genetic liability to ADHD2022 had a suggestive causal effect on T2D (OR: 1.30, p=0.086). Genetic liability to T2D was associated with a higher risk for ADHD2019 (OR: 1.05, p=0.001) and ADHD2022 (OR: 1.03, p<0.001). The polygenic overlap analysis showed that most causal variants of T2D are shared with ADHD2022. T2D and ADHD2022 have three overlapping loci. Molecular pathway analysis suggests that ADHD and T2D could promote the risk of each other through inflammatory pathways.
Conclusions Our study demonstrates substantial shared genetics and bidirectional causal associations between ADHD and T2D.
- Genetics, Behavioral
Data availability statement
No data are available.
This is an open access article distributed in accordance with the Creative Commons Attribution Non Commercial (CC BY-NC 4.0) license, which permits others to distribute, remix, adapt, build upon this work non-commercially, and license their derivative works on different terms, provided the original work is properly cited, appropriate credit is given, any changes made indicated, and the use is non-commercial. See: http://creativecommons.org/licenses/by-nc/4.0/.
Statistics from Altmetric.com
WHAT IS ALREADY KNOWN ON THIS TOPIC
Attention-deficit/hyperactivity disorder (ADHD) and type 2 diabetes (T2D) have high comorbidity and might be risk factors for each other. The causal associations and shared genetic architecture between ADHD and T2D need to be further elucidated.
WHAT THIS STUDY ADDS
ADHD may remarkably increase the risk of T2D, while T2D may modestly increase the risk of ADHD. ADHD and T2D have substantial shared genetics with one another.
HOW THIS STUDY MIGHT AFFECT RESEARCH, PRACTICE OR POLICY
More care should be taken for patients with ADHD with abnormal glucose metabolism. Surveillance of blood glucose levels in patients with ADHD may be necessary for the early diagnosis of diabetes.
Introduction
Type 2 diabetes (T2D) is a common metabolic disorder that affects approximately 10.5% of people 20–79 years old.1 The disease shortens life expectancy and burdens public healthcare systems. In addition to age, a combination of genetic and environmental factors may contribute to the development of T2D. These factors influence the onset, progression and associated comorbidities of the disease. Numerous risk factors have been reported for the illness, including adiposity, metabolic syndrome, sedentary lifestyle and cardiovascular conditions.2 3 Conversely, T2D and abnormal glucose metabolism are risk factors for myriad health conditions.4–6
The high comorbidity of T2D with major mental disorders is well established.7 It was estimated that the prevalence of T2D ranges from 5% to 22% in patients with psychiatric disorders.8 Attention-deficit/hyperactivity disorder (ADHD) is a common neurodevelopmental disorder in children with high heritability. ADHD affects approximately 6%–7% of people aged 18 and under when diagnosed via the Diagnostic and Statistical Manual of Mental Disorders, Fourth Edition (DSM-IV) criteria.9 It has been found that 30%–50% of people diagnosed in childhood continue to have ADHD into adulthood.10 ADHD substantially shares genetics with other common mental disorders, including major depressive disorder.11–14 In one of the recent studies, an association of the genetic liability to ADHD, as captured by the polygenic risk score, with T2D did not survive multiple test corrections, while the risk for type 1 diabetes (T1D) was uncovered with an odds ratio (OR) approximated as 1.21.15
The Mendelian randomisation (MR) approach has been widely used to explore causal associations between traits.16–19 A recent MR study reported a causal effect of ADHD on T2D (OR=1.14) and vice versa (OR=1.09),20 thus confirming earlier reports that utilised bivariate latent causal variable analysis.21 Additionally, evidence from epidemiological studies suggests that maternal prepregnancy diabetes is associated with an increased risk for ADHD with a modest effect size.22 However, the mechanisms underlying the connection between ADHD and T2D are largely unknown.
In the present study, we used two larger datasets on ADHD to validate the causal associations between this condition and T2D. Furthermore, we performed genetic correlation, polygenic overlap and literature-based analyses to evaluate genetic relationships between T2D and ADHD and explore the underlying mechanisms.
Methods
Data sources and study design
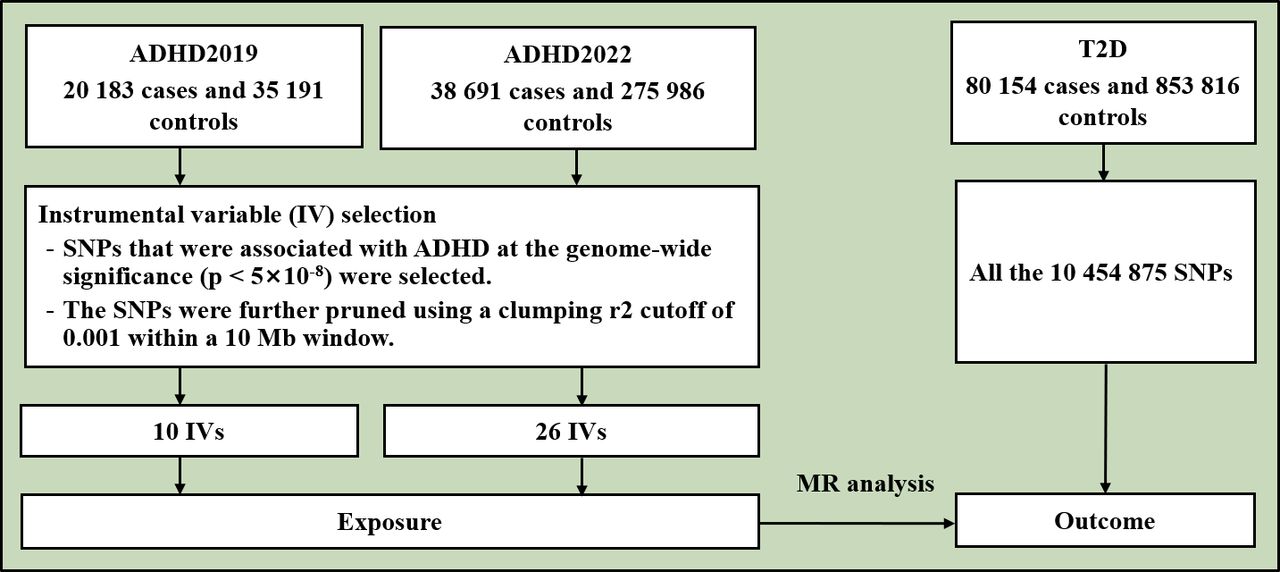
The flowchart of the study is shown in figure 1. This study is based on publicly available genome-wide association study (GWAS) summary results of T2D and ADHD. Previously, Mahajan et al performed a multiancestry GWAS of T2D in 180 834 cases and 1 159 055 controls.23 We used the GWAS summary result of T2D of the European population from the DIAbetes Genetics Replication And Meta-analysis (DIAGRAM) Consortium, including 80 154 T2D cases and 853 816 controls.23 Demontis et al performed a GWAS on ADHD in 2019 (ADHD2019)24 and expanded the sample size in 2022 (ADHD2022).25 The GWAS summary result of ADHD2019 included 20 183 cases and 35 191 controls.24 The ADHD2019 dataset contained ~210 000 missing rsIDs. We filled in most of these missing rsIDs using reference datasets. The GWAS summary result of ADHD2022 included 38 691 cases and 275 986 controls.25 The two ADHD datasets were obtained from the Psychiatric Genomics Consortium (https://pgc.unc.edu/). All participants were of European origin.

Flowchart of the study. ADHD was the exposure and T2D was the outcome in the MR analysis. ADHD, attention-deficit/hyperactivity disorder; IV, instrumental variable; SNPs, single nucleotide polymorphisms; T2D, type 2 diabetes.
Genetic correlation analysis
The genetic correlation between T2D and ADHD was calculated using linkage disequilibrium (LD) score regression.26 The 1 000 Genome Project phase 3 was used to estimate the LD structure for European populations.26 Single nucleotide polymorphisms (SNPs) were filtered by 1.1 million variants, a subset of 1 000 Genomes and Haplotype Map (HapMap) 3, with minor allele frequency (MAF) above 0.05.
Polygenic overlap analysis
Polygenic overlap, which measures the fraction of genetic variants causally associated with two traits over the total number of causal variants across a pair of traits involved, was analysed by MiXeR using default parameters.27 The test statistics of MiXeR consider the effects of LD structure, MAF, sample size, cryptic relationships and sample overlap. We evaluated the sets of causal variants shared between T2D and ADHD.
Two-sample MR analysis
The main analysis was performed using the inverse-variance weighted method and complemented with the weighted median and MR-Egger methods implemented in TwoSampleMR.28 For each MR analysis, SNPs with genome-wide significance (p<5×10⁻⁸) were selected as instrumental variables (IVs) and further pruned using a clumping r2 cut-off of 0.001 within a 10 Mb window. The intercept from the MR-Egger model was used as a measure of directional pleiotropy. The heterogeneity in the MR analysis was evaluated by Cochran’s Q test and I2 statistics (p<0.050 and I2>0.25).
Overlapping genomic variation between T2D and ADHD2022
To identify overlapping risk genes between T2D and ADHD, we retrieved genomic loci for the two traits from the two GWAS datasets. The functional mapping and annotation (FUMA) software was used to map SNPs to genes and identify LD-independent genomic regions.29 All genes located within the 10 kb vicinity of each variant were mapped. Independent significant SNPs were extracted when their p value was genome-wide significant (p<5×10⁻⁸) and independent of each other (r2<0.6). The lead SNPs were identified as a subset of the independent significant SNPs in LD with each other at r2<0.1 within a 500 kb window. Genomic risk loci were identified by merging lead SNPs located at a distance of less than 500 kb from each other. Clumping procedures were carried out in accordance with the European 1 000 Genomes Project phase 3 reference panels. Due to extensive LD, the entire major histocompatibility complex locus was merged into one region (chr6: 25–35 Mb). Regional association results of the loci were plotted using LocusZoom.30
Knowledge-based analysis
At the molecular level, the potential connection between ADHD and T2D was explored by structured, large-scale mining of literature in the Pathway Studio (www.pathwaystudio.com) environment,31 followed by the construction of a set of molecular pathways connecting ADHD and T2D. We identified lists of known downstream targets and upstream regulators of ADHD and T2D. For each extracted relationship, references were evaluated manually for quality control, and then all non-directional relationships, for example, ‘change’ and ‘alteration’, were removed. The remaining directional relationships, for example, ‘decrease’, ‘upregulation’ and ‘stimulation’, were mapped, and a set of molecular pathways connecting ADHD and T2D was built.
We termed the proteins connecting ADHD and T2D ‘mediating proteins’ and their coding genes ‘mediating genes’. Kyoto Encyclopedia of Genes and Genomes (KEGG)-based pathway enrichment analyses of the mediating genes were conducted using FUMA.29
Results
Genetic correlation analysis
The genetic correlation analysis indicated that T2D has significant positive genetic correlations with ADHD in both the ADHD2019 (rg=0.33 (0.03), p<0.001) and ADHD2022 (rg=0.31 (0.02), p<0.001) datasets.
Polygenic overlap analysis
Polygenic overlap analysis identified 2 555 (389) and 7 808 (363) risk variants for T2D and ADHD2022, respectively (figure 2). The ADHD polygenicity was much higher than that of T2D. The two disorders have 1 789 common risk variants in common. Therefore, T2D shared most of its causal variants with ADHD2022 (70%). The vast majority of the risk variants shared between T2D and ADHD2022 have the same effect directions (90%).
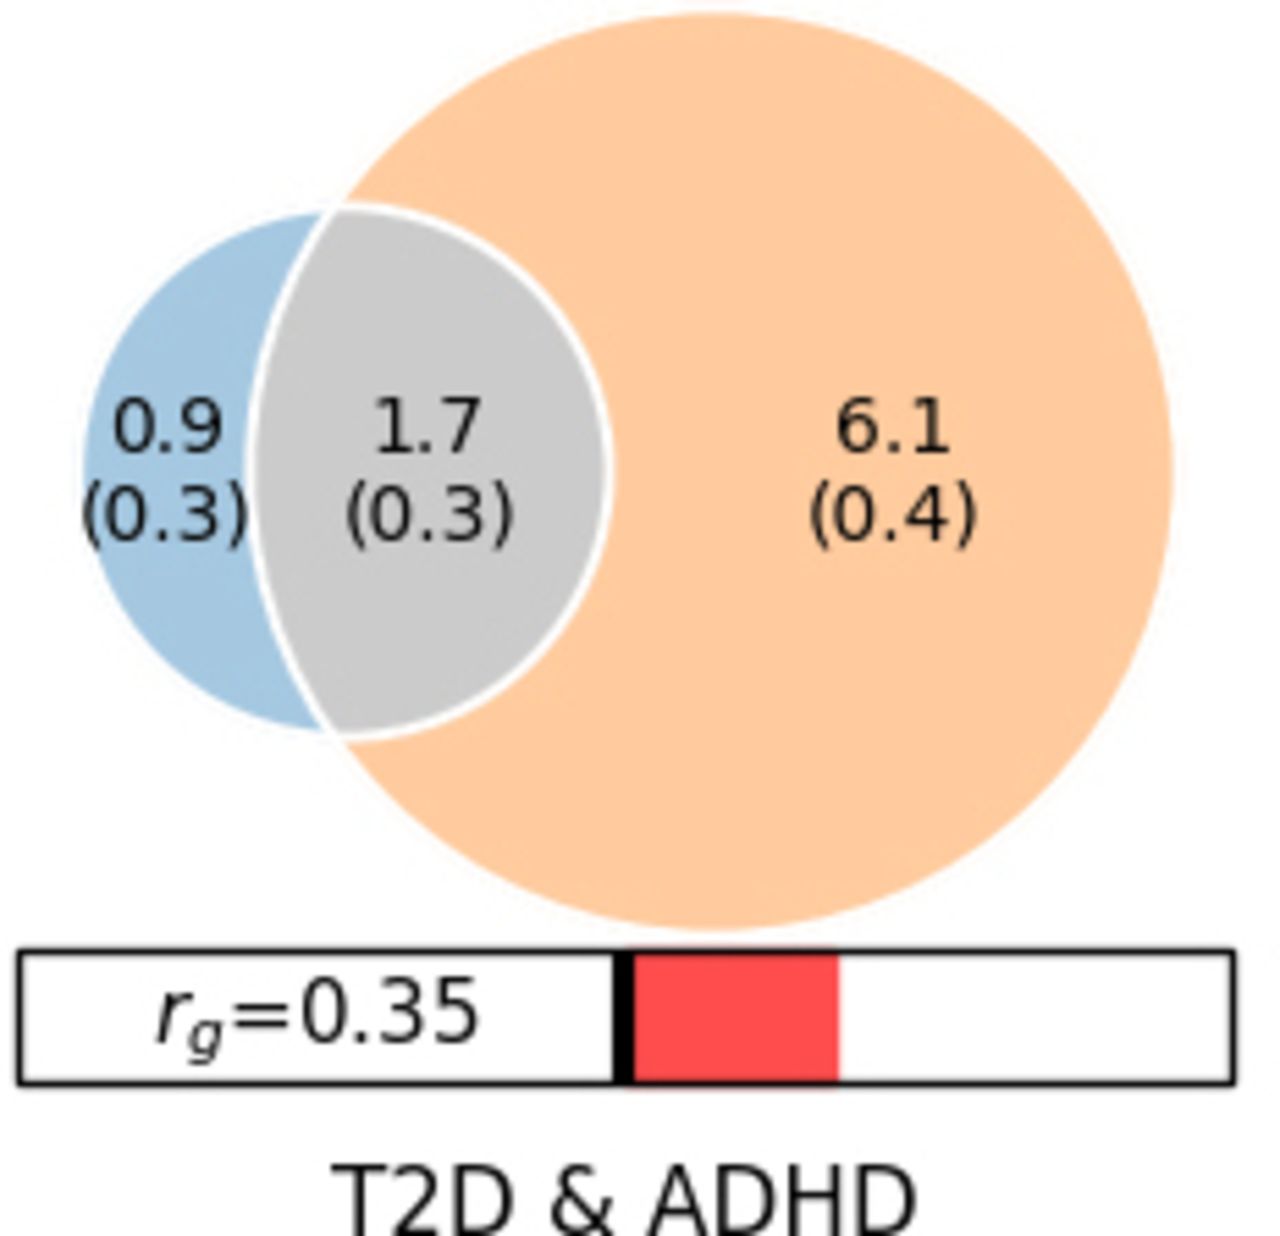
Polygenic overlaps between T2D and ADHD2022. Venn diagrams of unique and shared causal variants between T2D and ADHD2022. The numbers indicate the estimated quantity of causal variants (in thousands). ADHD, attention-deficit/hyperactivity disorder; T2D, type 2 diabetes.
Mendelian randomisation analysis
In the MR analysis of the causal effect of ADHD on T2D, a total of 10 and 26 IVs were obtained for the ADHD2019 and ADHD2022 datasets, respectively. We found that genetic liabilities to ADHD2019 conferred a causal effect on T2D (OR: 1.30, 95% confidence interval (CI): 1.16 to 1.46, p<0.001), while in the ADHD2022 dataset, the causal effects of genetic liability to ADHD2022 on T2D were suggestive (OR: 1.30, 95% CI: 0.96 to 1.76, p=0.086).
In the MR analysis of the causal effect of T2D on ADHD, a total of 194 IVs were obtained. The results showed that genetic liability to T2D was associated with a higher risk for ADHD in both datasets (ADHD2019 (OR: 1.05, 95% CI: 1.02 to 1.07, p<0.001) and ADHD2022 (OR: 1.03, 95% CI: 1.01 to 1.04, p<0.001)) (table 1).
Causal associations between T2D and ADHD
MR sensitivity analysis showed that the directions of causal effect estimates across the set of applied techniques were largely the same (table 1 and online supplemental table 1). The MR-Egger regression did not support directional pleiotropy in the MR analysis (MR-Egger intercept<0.01, p>0.050). The evidence of directional pleiotropy for the IVs from the MR-Egger regression was minimal, indicating the robustness of the main results. However, there was evidence supporting the potential heterogeneity in the causal effect of T2D on ADHD (Cochran’s p<0.001, I2=0.328).
Supplemental material
Overlapping genomic variation between T2D and ADHD2022
In FUMA analysis, a total of 27 and 199 genomic loci were associated with ADHD2022 and T2D, respectively (figure 3). Three genomic loci overlapped between T2D and ADHD2022 (figure 3). These loci included seven protein-coding genes shared between ADHD and T2D, including CAMKV, MST1R, MON1A, RBM6, RBM5 (3p21.31), ARHGAP39 (8q24.3) and NKX2-2 (20p11).

GWAS results of ADHD2022 and T2D. (A) Manhattan plot of ADHD2022 and T2D. The x-axis is the chromosomal position of SNPs, and the y-axis is the significance of the SNPs (−log10P). Each horizontal dashed line denotes the genome-wide significance level of 5E−8. Red arrows indicate the three overlapping genomic loci between ADHD and T2D. (B) Three overlapping loci between ADHD2022 and T2D. ADHD, attention-deficit/hyperactivity disorder; GWAS, genome-wide association study; SNP, single nucleotide polymorphism; T2D, type 2 diabetes.
Genetic pathways connecting T2D to ADHD
Literature-based pathway analysis identified a total of 10 mediating genes from ADHD and T2D. ADHD positively influenced T2D through seven molecules and negatively influenced T2D through three molecules (figure 4A). Therefore, the overall effect of ADHD on T2D could be promoted at the molecular level. KEGG-based pathway enrichment analysis in FUMA showed that the seven genes are involved in immunity-related molecular pathways, including asthma, allograft rejection and cytokine–cytokine-receptor interaction (figure 4C).

Pathway and protein–protein interaction analyses. (A) ADHD-driven molecular pathway influencing T2D. Quantitative genetic changes driven by ADHD exert more negative (highlighted in red) than positive (highlighted in green) effects on T2D. ‘--+>’ represents positive regulation; ‘--|’ represents negative regulation. (B) T2D-driven molecular pathway influencing ADHD. (C) KEGG-based pathway analysis of the mediating genes. ADHD, attention-deficit/hyperactivity disorder; KEGG, Kyoto Encyclopedia of Genes and Genomes; T2D, type 2 diabetes.
On the other hand, T2D can positively influence ADHD through three molecules and negatively influence ADHD through one molecule (figure 4B).
Discussion
Main findings
This study aimed to determine the genetic correlation between T2D and ADHD. Our analysis supports the positive relationship between these two conditions. We used a bivariate Gaussian mixture model to evaluate an overlap between causal variants of T2D and ADHD. T2D shares the majority of its causal variants (70%) with ADHD. The vast majority of these causal variants had concordant effect directions (90%), consistent with the positive genetic correlation between them.
Our MR analyses indicated that the relationships between T2D and ADHD are bidirectional and causal, with a much larger effect exerted by ADHD on T2D than the reverse. The diagnosis of ADHD was associated with a 30% increased risk for T2D, while the diagnosis of T2D was associated with a 3%–5% increased risk for ADHD. Tao et al analysed the causal association between ADHD2019 and T2D.20 Compared with Tao et al’s study, our ADHD2019 dataset yielded more IVs (10 vs 8), which may explain why our study detected a more robust result. Of note, ADHD conferred a larger effect on T2D than vice versa, which may be due to the much larger genetic polygenicity detected for ADHD than for T2D. A recent study by Garcia-Marin et al revealed that genetic liability to T2D increases the risk of ADHD in children.21 Another recent analysis showed that genetic correlations between ADHD and metabolic syndrome, a precursor for T2D, are positive, and this relationship is primarily mediated by the pathway of insulin processing/secretion.32 Separately, positive genetic relationships were noted for ADHD and various insulin-related somatic traits.32
When the functional pathway connecting ADHD and T2D was drawn based on literature data, the majority of identified molecules promoted comorbidity rather than being discordant in their effects (figure 4). The ADHD-driven T2D-promoting molecules were represented mostly by soluble cytokines and biomarkers of endothelial inflammation, including vascular cell adhesion molecule 1 and intercellular adhesion molecule 1. While the role of systemic inflammation in T2D pathophysiology is well established,33 our study supports the previously proposed hypothesis that emphasises inflammation as an important part of ADHD pathophysiology.34
Our cross-trait T2D and ADHD analysis revealed three novel loci harbouring seven protein-coding genes. The shared pathophysiology of these two diseases may be mediated by the pleiotropic effects of these genes, at least in part. The list of pleiotropic risk factors acting across T2D and ADHD includes CAMKV, MST1R, MON1A, RBM6, RBM5 (3p21.31), ARHGAP39 (8q24.3), and NKX2-2 (20p11).
Limitations
This study measured only genetic liability for both diseases and did not consider the effects of environmental factors; therefore, its conclusion may be limited in its scope. Some factors, including intelligence and education, may influence both ADHD and T2D.14 35 These factors may mediate the associations between these two conditions. ADHD and autism spectrum disorder (ASD) are commonly comorbid and share substantial liability.13 14 However, our study did not include ASD, which warrants further investigation.
Implications
This study provides evidence of the genetic association between T2D and ADHD. Several immune system genes were identified to be common to the two diseases. In summary, our findings suggest that T2D and ADHD share substantial genetic components that are mutual risk factors promoting comorbidity. Our findings point to possible transcriptional coregulation of diabetes and ADHD-promoting molecular pathways that these nosological entities may share.
Data availability statement
No data are available.
Ethics statements
Patient consent for publication
Ethics approval
Not applicable.
Acknowledgments
We thank members of the Psychiatric Genomics Consortium and other teams who generously shared the GWAS data. We are thankful to iPSYCH (Ditte Demontis and Anders Børglum) and deCODE (G. Bragi Walters, Hreinn Stefansson and Kari Stefansson) for giving us access to the recent GWAS meta-analysis summary statistics of ADHD.
References
Ancha Baranova graduated with a PhD from Moscow State University, Russia in 1998 and a DSci from the Russian Academy of Science in 2004. Currently, she is a professor in the School of Systems Biology at George Mason University in Virginia, USA. She has expertise in various research fields, including chronic liver diseases, cancer and other illnesses and antiageing. Her lab has discovered many biomarkers for chronic liver diseases, cancer and other illnesses, the biosynthesis of melanin in human adipose, some properties of cell-free DNA and various novel functions for known biomolecules. Recently, Dr Baranova has engaged in antiageing research and its major pathophysiological components, namely systemic inflammation, insulin resistance and organ fibrosis. Her work in personalised medicine has a particular emphasis on longitudinal monitoring, the management of health in presymptomatic individuals and augmenting the body’s homeostasis by non-pharmacological means.

Supplementary materials
Supplementary Data
This web only file has been produced by the BMJ Publishing Group from an electronic file supplied by the author(s) and has not been edited for content.
Footnotes
Contributors FZ conceived the project and supervised the study. AB, VC and FZ wrote the manuscript. FZ and HC analysed the data and created the figures and tables. FZ was responsible for the overall content as the guarantor. All authors read and approved the final manuscript.
Funding The authors have not declared a specific grant for this research from any funding agency in the public, commercial or not-for-profit sectors.
Competing interests None declared.
Provenance and peer review Not commissioned; externally peer reviewed.
Supplemental material This content has been supplied by the author(s). It has not been vetted by BMJ Publishing Group Limited (BMJ) and may not have been peer-reviewed. Any opinions or recommendations discussed are solely those of the author(s) and are not endorsed by BMJ. BMJ disclaims all liability and responsibility arising from any reliance placed on the content. Where the content includes any translated material, BMJ does not warrant the accuracy and reliability of the translations (including but not limited to local regulations, clinical guidelines, terminology, drug names and drug dosages), and is not responsible for any error and/or omissions arising from translation and adaptation or otherwise.