Article Text

Abstract
Background Neural oscillations directly reflect the rhythmic changes of brain activities during the resting state or while performing specific tasks. Abnormal neural oscillations have been discovered in patients with schizophrenia. However, there is limited evidence available on abnormal spontaneous neural oscillations in clinical high risk for psychosis (CHR-P). The brain signals recorded by the magnetoencephalography (MEG) technique are not to be disrupted by the skull and scalp.
Methods In this study, we applied the MEG technique to record the resting-state neural activities in CHR-P. This was followed by a detailed MEG analysis method including three steps: (1) preprocessing, which was band-pass filtering based on the 0.5–60 Hz frequency range, removal of 50 Hz power frequency interference, and removal of electrocardiography (ECG) and electrooculography (EOG) artefacts by independent component analysis; (2) time-frequency analysis, a multitaper time-frequency transformation based on the Hanning window, and (3) source localisation, an exact low-resolution brain electromagnetic tomography. The method was verified by comparing a participant with CHR-P with a healthy control during the MEG recordings with an eyes-closed resting state.
Results Experimental results show that the neural oscillations in CHR-P were significantly abnormal in the theta frequency band (4–7 Hz) and the delta frequency band (1–3 Hz). Also, relevant brain regions were located in the left occipital lobe and left temporo-occipital junction for the theta band and in the right dorsolateral prefrontal lobe and near orbitofrontal gyrus for the delta band.
Conclusions Abnormal neural oscillations based on specific frequency bands and corresponding brain sources may become biomarkers for high-risk groups. Further work will validate these characteristics in CHR-P cohorts.
- Psychiatry
- Schizophrenia
Data availability statement
Data are available on reasonable request.
This is an open access article distributed in accordance with the Creative Commons Attribution Non Commercial (CC BY-NC 4.0) license, which permits others to distribute, remix, adapt, build upon this work non-commercially, and license their derivative works on different terms, provided the original work is properly cited, appropriate credit is given, any changes made indicated, and the use is non-commercial. See: http://creativecommons.org/licenses/by-nc/4.0/.
Statistics from Altmetric.com
Key messages
What is already known on this topic
Due to the lack of an effective technique to record and analyse the characteristics of brain neural oscillations, the neural mechanism of clinical high risk for psychosis (CHR-P) is unclear.
What this study adds
In this study, a new technique, magnetoencephalography, was used to record the neural oscillation signals of a participant with CHR-P, and the analysis method of this technique was introduced in detail.
How this study might affect research, practice or policy
This study provides methodological support for exploring the neural mechanism of CHR-P.
Introduction
Neural oscillations play an essential role in brain function because they are closely related to the integrity of cognitive and sensory processes by promoting communication between neuronal groups.1 2 New evidence suggests that psychotic disorders are accompanied by significant cognitive impairments and abnormal neural oscillations, such as schizophrenia, but the essence of the impairments, the occurrence of defects and the clinical applicability are still unclear.3 4 The changes in neural oscillations observed during the resting state in patients with schizophrenia include low-frequency activity increases5 and high-frequency activity decreases.6 In addition, it has been proven that a decrease of oscillation amplitude is accompanied by a decrease of oscillation coherence at the theta frequency band.7 The resting state8 reflects a spontaneous neural activity that is observable when participants remain relaxed and do not engage in any particular task during a scan, thus, representing the brain’s intrinsic activities.
In recent years, the clinical high risk for psychosis (CHR-P) paradigm has played an important role in psychiatric research because of its advantages of early identification, prevention and intervention.9 10 Early signs of psychosis are associated with cognitive deficits; thus, identifying circuit abnormalities and biomarkers in participants with CHR-P has become the focus of psychosis studies.11 However, there is limited evidence of alterations of neural oscillations in participants with CHR-P.1 Time-frequency analysis is an effective technique to describe the characteristics of neural oscillations.12 By comparing the power spectra values of time-frequency, the frequency band of interest in which abnormal neural oscillations occur will be observed. Based on oscillation signals in the abnormal frequency band, studies to date have failed to identify the source locations in the brain cortex of high-risk participants. Source localisation methods13–16 can successfully identify the locations of oscillation signals and play a key role in magnetoencephalography (MEG) analysis. Because the MEG signals have the advantages of direct, clean, dynamic, safe and non-invasive recordings,17 they offer a hope for capturing the intrinsic characteristics of neural oscillations.
We hypothesised that the neural oscillations are abnormal in individuals at high risk of psychosis. In this study, the MEG analysis methods were introduced to describe the characteristics of neural oscillations in participants with CHR-P, including preprocessing, time-frequency analysis and source localisation. An abnormal oscillation frequency band and its corresponding locations in the individual’s brain cortex were found using the proposed methods.
Methods
Clinical design
The Structured Interview for Prodromal Syndromes (SIPS) scale18 was used to determine whether the subject met criteria for CHR status through a face-to-face interview. The SIPS contains 19 items that assess four symptoms: positive symptoms (scales P1–P5), negative symptoms (scales N1–N6), disorganised symptoms (scales D1–D4) and general symptoms (scales G1–G4). The participant with CHR-P was recruited from an outpatient treatment programme at the Shanghai Mental Health Center. The exclusion criteria included significant neurological disorders, major medical illnesses affecting the central nervous system, a history of suicide risk, and alcohol or drug abuse. A healthy control (HC) was recruited from the community via poster advertisements. The participants were aged between 18 and 60 years and had completed 9 years of compulsory education.
Data collection
The MEG measurements were collected inside a magnetically shielded room using a helmet-shaped whole-head system (ARMOR, Elekta Neuromag TRIUX, Finland) by 306 channels in total, comprising 102 locations. Each location includes three sensors: one magnetometer and two orthogonal planar gradiometers. Continuous MEG signals were recorded at a sampling rate of 1000 Hz for the participants. Each participant sat at 60° and was in an eyes-closed resting state for 5 min. The three-dimensional (3D) T1 sequence of MRI was performed on a Siemens 3T (MAGNETOM Verio; Erlangen, Germany) equipped with a 32-channel head coil (Siemens Healthcare). A Polhemus 3D digitiser system (Colchester, New Hampshire, USA) was applied to determine the location based on anatomical fiducial points (nasion and bilateral preauricular points). We ensured that the head of the participant was not moved during the 5 min procedure.
Preprocessing and time-frequency analysis
The methodology is crucial for understanding the neural oscillation signals recorded by MEG. Two toolboxes, including FieldTrip19 and MATLAB V.R2014a (The MathWorks, Natick, Massachusetts, USA), were used to analyse the MEG measurements. Figure 1 shows a detailed flow chart of the analysis method of the MEG data in this study. First, the preprocessing step was used to improve the MEG signal quality. The continuous data was divided into many segments using 10 s as segmentation and filtered using a band-pass filter of 0.5–60 Hz and notch-filtering at 50 Hz. Independent component analysis was used to remove eye movement artefacts and ECG artefacts. Second, the time-frequency analysis was applied to find the abnormal frequency band in the participant with CHR-P relative to the healthy individual. The multitaper time-frequency transformation based on the Hanning window was performed in this study. In the following section, the third step of the MEG analysis method, source localisation, will be introduced in detail.

The flowchart of MEG data analysis, where source localisation consists of four parts: head model construction, forward solution, inverse solution and source display. eLORETA, exact low-resolution brain electromagnetic tomography; MEG, magnetoencephalography.
Source localisation
Source localisation was performed based on the above two steps to observe the brain activity regions in an abnormal frequency band. The method includes head model construction, forward solution, inverse solution and source display. The four steps are shown in figure 1. In the head model construction, a realistically shaped single-shell approximation20 was used to construct a volume conduction model. An iterative closest point algorithm21 was used to co-register the individual MRI and the digitised head shapes to the MEG coordinate system. The probabilistic tissue maps of grey matter were acquired by the technique of volume segmentation using the anatomical MRI. The inverse solution in figure 1 played a crucial role in source localisation and was estimated by exact low-resolution brain electromagnetic tomography (eLORETA)15 16 in this study.
In the inverse solution, we first used the frequency band of interest obtained from the results of time-frequency analysis, such as 1–3 Hz, to perform band-pass filtering on the preprocessed MEG data. Then, principal component analysis was applied to extract the features of the previous step’s results. A solution to the inverse problem by using eLORETA technique that attains exact localisation was described as follows.
The magnetic field measurements were represented as a symbol Y. For a measurement matrix  , the forward equation is described as:
 (1)
(1)
where y(i) denotes an M×1 vector of the MEG measurements at the i-th time point, K is the M×J (lead-field) gain matrix, M is the number of MEG sensors, J is the number of voxels, X represents a J×N current density matrix for a given time series, and ε denotes the M×N noise matrix. Then, a form of linear solutions of formula (1) is:
 (2)
(2)
where α≥0 is the Tikhonov regularisation factor,22 and W is a weight matrix with symmetric positive definiteness. The classic weighted minimum norm solution of formula (2) is:
 (3)
(3)
where  , I is an identity matrix, and 1 is an M×1 vector where all elements are 1. The key step of eLORETA algorithm is to estimate the weights for exact localisation with zero error. The non-linear solution of the weights is given as:
 (4)
(4)
where  represents the elements of the diagonal matrix W. The formula (4) is implemented by an iterative algorithm.15 23 Thus, the strength of all voxels is calculated for finding the location of the source, which is the voxel location corresponding to the maximum strength. The source display was performed using the ft_sourceplot function in FieldTrip, where the method parameter was ‘ortho’.
Results
Demographic and clinical characteristics
The sex, age, height and weight of the participant with CHR-P were female, 31 years, 163 cm and 60 kg, respectively, and those of the HC individual were female, 38 years, 167 cm and 60 kg, respectively. The scores of positive symptoms of the participant with CHR-P from P1 to P5 in SIPS were 3, 2, 0, 0 and 0, respectively. Since the value of P1 was greater than or equal to 3, the participant was assessed as high risk for psychosis according to the SIPS rating criteria. In addition, the participant with CHR-P had mild negative symptoms and depressive symptoms.
Time-frequency analysis
The results of the comparison of CHR-P versus HC in time-frequency analysis are shown in figure 2. The spectrum values in figure 2 were generated based on two steps: (1) the grand average of the spectrum values of all channels on a segment and (2) the average of the spectral values generated in the first step of all segments. Based on subgraph A (CHR-P) of figure 2, high-power spectra values were concentrated in the frequency bands of delta (1–3 Hz), theta (4–7 Hz) and alpha (8–13 Hz), while these values were concentrated in the alpha and the delta frequency bands in subgraph B (HC). Experimental results show that the neural oscillations in the participant with CHR-P were significantly abnormal in the theta frequency band (4–7 Hz) and the delta frequency band (1–3 Hz). Compared with the HC results, the power spectrum of CHR-P was significantly enhanced in the two frequency bands.
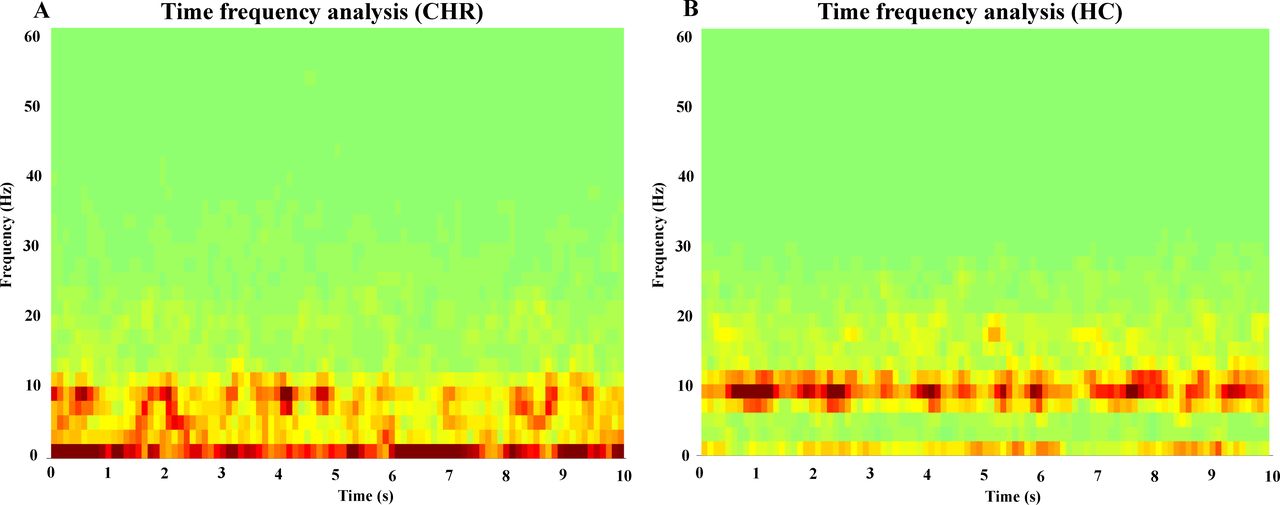
Comparison of time-frequency analysis results in (A) clinical high-risk for psychosis (CHR) versus (B) healthy control (HC).
Source localisation
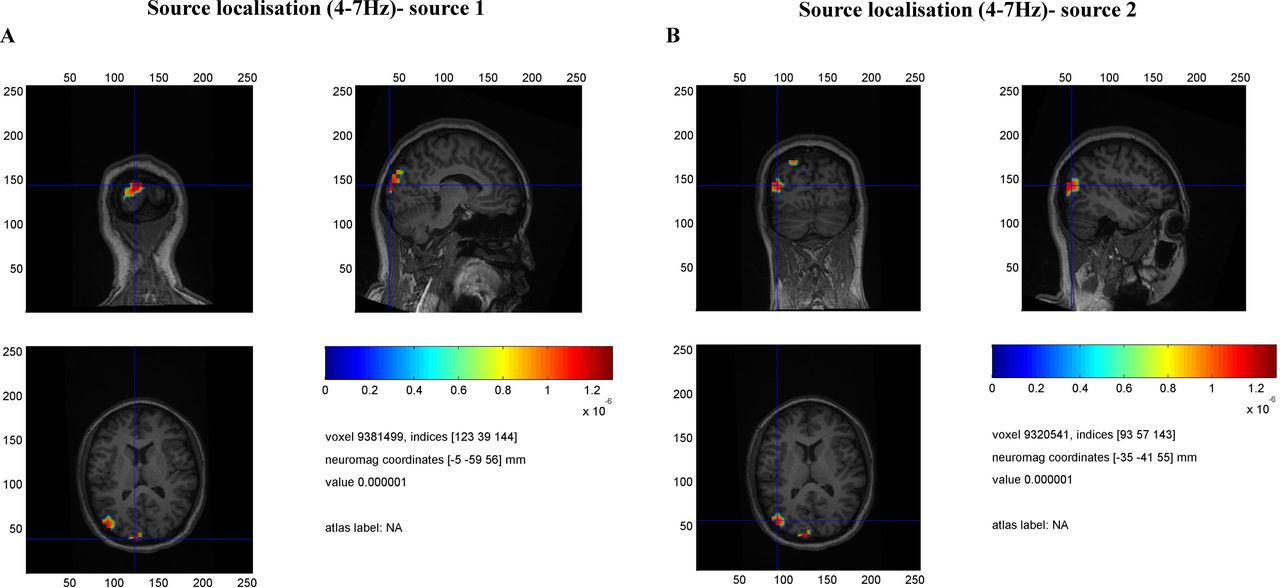
According to the results of the time-frequency analysis, we further hoped to determine which regions in the individual MRI of the participant with CHR-P were activated based on the MEG signals of the two frequency bands of abnormal neural oscillations. Figures 3 and 4 show the source localisation results using the proposed method. Two sources, the left occipital lobe (near cuneus lobe) and the left temporo-occipital junction, were found for the theta-band oscillations. Also, relevant brain regions were identified in the right dorsolateral prefrontal lobe and near the right orbitofrontal gyrus for delta-band oscillations.

Source localisation results on theta-band (4–7 Hz) oscillation, including (A) left occipital lobe (near cuneus lobe) and (B) left temporo-occipital junction. The results of source 1 and source 2 are from the clinical high-risk for psychosis.

Source localisation results on delta-band (1–3 Hz) oscillation, including (A) right dorsolateral prefrontal lobe and (B) near the right orbitofrontal gyrus. The results of source 1 and source 2 are from the clinical high-risk for psychosis.
Discussion
In this study, we described in detail the analysis methods of MEG recordings, including preprocessing, time-frequency analysis and source localisation, to find abnormal neural oscillations in participants with CHR-P. The methods were preliminarily verified by comparing a participant at high risk of psychosis with an HC. Direct evidence for abnormal power spectra values of neural oscillations during the resting state was found in CHR-P.
An important study1 has shown that gamma-band oscillations in participants with CHR-P were impaired and related to the visual cortex; the fronto-occipital connectivity was also impaired. We demonstrated that the neural oscillations in clinical high-risk psychosis were abnormal and occurred in the primary visual cortex and frontal cortex. We also found that the oscillation signals in the low-frequency band were impaired, rather than in the high-frequency band, which may be related to our exploration of the resting state in this study. Previous studies24 25 have shown that anhedonia was related to the activation of the orbitofrontal cortex in individuals with CHR-P; this is consistent with our study’s conclusion of the activation of the right orbitofrontal lobe in the delta band. A CHR-P state without obvious psychiatric symptoms was characterised by abnormally increased low-frequency and high-frequency activities.26 Deficits in circuits that generate low-frequency oscillations, such as those we found, play an important role in schizophrenia.27 Our study also discovered that the neural oscillations in the participant with CHR-P were significantly abnormal in the theta frequency band and the delta frequency band. Finally, our study’s findings imply that a quiet and comfortable MEG scanning environment may be essential for psychosis evaluation.
Limitations
This study only preliminarily verified that neural oscillations were abnormal in high-risk groups for psychosis. Accordingly, further studies with larger samples are required to verify the cross-sectional course of neural oscillation deficits in participants with CHR-P.
Conclusions
In the present study, we applied a novel technique, MEG imaging, to record the resting-state neural activities in a participant with CHR-P. The methods of MEG analysis were introduced in detail, including preprocessing, multitaper time-frequency analysis and eLORETA source localisation. Experimental results show that the neural oscillations were significantly abnormal in the theta frequency band (4–7 Hz) and the delta frequency band (1–3 Hz). Relevant brain regions were identified in the left occipital lobe and the left temporo-occipital junction for the theta band and the right dorsolateral prefrontal lobe and near the orbitofrontal gyrus for the delta band.
Data availability statement
Data are available on reasonable request.
Ethics statements
Patient consent for publication
Ethics approval
The study was performed under a protocol approved by the Medical Ethics Committee of the Shanghai Mental Health Center (ID: 2017-36R). Participants gave informed consent to participate in the study before taking part.
References
Hu Yegang obtained a PhD degree in Biomedical Engineering from Beihang University, Beijing, China, in 2018. Since 2018, he has been an assistant professor with the Brain Electrophysiology Laboratory in the Shanghai Mental Health Center (SMHC), Shanghai, China. He was supported by the FeiXiang Talent Plan of SMHC, the Youth Project of the National Natural Science Foundation of China, the Youth Project of the Clinical Research Plan of Shenkang Three-year Action, and the Exploration Project of the Shanghai Natural Science Foundation. He has participated in many projects, including those from the Ministry of Science and Technology of China, the National Key R&D Program of China, and the National Natural Science Foundation of China. His academic part-time job includes participation in the Youth Committee of the EEG and clinical neurophysiology branch of the Shanghai Medical Association. He is also a review editor for Frontiers in Psychiatry and Frontiers in Human Neuroscience. He has published eight SCI/EI papers as the first author. His main research interests include magnetoencephalography (MEG) analysis, auditory hallucinations, and localization of the epileptogenic zone.

Footnotes
Contributors YH designed the research, wrote the manuscript, and designed and implemented algorithm. XT, YW and YT prepared figures and tables. JW, YC, LX, QG, GW and ZQ collected clinical data. CL, TZ and JW supervised the study and revised the manuscript. All authors contributed to and approved the final manuscript.
Funding This study was supported by the National Natural Science Foundation of China (81901832, 82171544, 82171497, 62072014), Clinical Research Plan of SHDC (SHDC2020CR4066), Science and Technology Commission of Shanghai Municipality (19ZR1477800, 19ZR1445200), Shanghai Key Laboratory of Psychotic Disorders (13dz2260500), Clinical Research Center at Shanghai Mental Health Center (CRC2018ZD01, CRC2018ZD04 and CRC2018YB01), and Shanghai Mental Health Center Foundation (2020-FX-01, 2019-zd01).
Competing interests None declared.
Provenance and peer review Not commissioned; externally peer reviewed.