Article Text

Abstract
Diagnostic tests are usually based on some quantitative biomarkers. Two key parameters used to characterise the quality of a test are test sensitivity and specificity. Predictive values of the disease status based on test results are also of interest in medical research and public health management. In this paper, we study the relations among sensitivity, specificity and predictive values of the test. The core concept is risk function, which is assumed to be an increasing function of the biomarker. Our results show that test sensitivity and specificity change in opposite directions. The positive predictive value and the sensitivity also change in opposite directions. Likewise, the negative predictive value and the specificity change in opposite directions.
- ROC curve
This is an open access article distributed in accordance with the Creative Commons Attribution Non Commercial (CC BY-NC 4.0) license, which permits others to distribute, remix, adapt, build upon this work non-commercially, and license their derivative works on different terms, provided the original work is properly cited, appropriate credit is given, any changes made indicated, and the use is non-commercial. See: http://creativecommons.org/licenses/by-nc/4.0/.
Statistics from Altmetric.com
Introduction
The COVID-19 pandemic has been soaring around the globe since March 2020.1 Every day, millions of people in the world get tested, and thousands of new cases are reported. More than 1.5 million died of the disease in 2020. Like many other infectious diseases, an effective way to stop the spread of the COVID-19 is to separate the infected and susceptible individuals for a period to time. For this purpose, we need to develop an efficient test to accurately identify those who are infected in the population.2 First, a good test can identify infected individuals in time so that they can get appropriate treatment immediately if they are in a serious situation. Second, we can separate the infected individuals from uninfected people in time, especially those at high risk. Current data show that age is an important risk factor for COVID-19. The risk increases significantly with age.3–7 People in nursing homes are usually of older ages and are particularly vulnerable to the virus. The mortality rate of COVID-19 in nursing homes is still very high. Therefore, it is extremely important for a test to correctly identify infected individuals and separate them from residents in nursing homes. To the general public, it is very important to find infected individuals in the community so that medical resources can be arranged to treat the infected individual and protect the rest of the population. A lot of chaos happened at the beginning of the COVID-19 pandemic. For example many people went to hospitals to seek help as they were not sure whether they were infected by the virus SARS-CoV-2, due to guidance not being clear in the beginning. Unfortunately, some became infected after they went to the hospital for other diseases. This kind of tragedy could have been mitigated if we had an effective test at the beginning of the pandemic.
In this report, we discuss measures of quality for a diagnostic test and the accuracy of testing using this diagnostic test. The paper is organised as follows. We first give a brief introduction of sensitivity and specificity of a test, and then discuss the positive and negative predictive values. We then explore the monotone relations among Se, Sp, positive predictive value (PPV) and negative predictive value (NPV). Numerical results are used to illustrate the relationship among 4 quantities.
Sensitivity and specificity of a test
For each randomly selected individual from the study population, we use a binary outcome D to denote the disease status (D=1 and 0 for disease and non-disease, respectively) and another binary outcome variable T to denote the test result, where T=1 and 0 for positive (the test says the individual has the disease) and negative (the test says the individual does not have the disease), respectively. Let p denote the prevalence (proportion) of the diseased individuals in the study population. Without loss of generality, assume 0 < p < 1. The prevalence is a population property and is independent of quality of a diagnostic test. In the following discussion, we assume that p is fixed.
We use P(A) to denote the probability of an event A. Therefore, p=P{D=1}, the probability that a randomly selected individual has the disease of interest. We also use P(A|B) to denote the conditional probability of event A given event B, assuming P(B)>0.
Ideally, a perfect test correctly distinguishes between diseased and non-diseased individuals; it reports positive for all diseased individuals and negative for all non-diseased individuals. However, this is almost impossible for any test to achieve due to many reasons. Generally, a diagnostic makes two types of mistake, as it may assign negative to a diseased individual and positive to a non-diseased individual.
We use two parameters to characterise the behaviour of the test.8 The sensitivity (Se), also called the true positive rate (TPR), is the probability that the test assigns a diseased individual as positive. It shows how sensitive the test is to detecting the disease. A perfect test has the sensitivity of 100%. However, 100% sensitivity does not mean the test is perfect. For example, a test that always reports positive for any individual in the population has 100% sensitivity but is useless. Another parameter is specificity (Sp), also called the true negative rate, is the probability that the test assigns a non-diseased individual as negative. It shows how specific the test is in detecting the absence of disease. Similarly, a perfect test has the specificity of 100%. However, 100% specificity does not mean the test is perfect. For example, a test that always reports negative for any individual in the population has 100% specificity but is also useless. A test that either reports positive or negative all the time has either 0% specificity or 0% sensitivity. An informative test should have Se >0 and Sp >0. We make this assumption in our following discussion.
Mathematically, sensitivity and specificity are conditional probabilities,


respectively. Note that

is called the false negative rate (FNR), the probability that a diseased individual is wrongly assigned to negative. Similarly,

is called the false positive rate (FPR), the probability that a non-diseased individual is wrongly assigned to positive.
For each randomly selected individual, (D, T) is a bivariate binary outcome. Since there are only four possible values for (D, T), we only need three parameters to specify its probability distribution. Here we express the joint distribution in terms of three parameters (p, Se and Sp),


From them we can calculate other quantities of interest. For example, the overall rate of misclassification is the proportion that the test result does not match the disease status, that is,

Predictive values of a test
From the definition of regression,9 sensitivity and specificity are the predictions of test result based on disease status. This is just one side of the story. Since no test is perfect, we are interested in the proportions of individuals who test positive and actually have the disease and the proportion of those who test negative and really have no disease. From the point of public health management, we want to know how the test result can be used to predict the disease status. For example, what is the probability that a randomly selected individual who is positive really has the disease? This probability is called the positive predictive value. Mathematically,

It is obvious that PPV=1 if and only if {T=1} is a subset of {D=1}. Otherwise, PPV <1. Similarly, the probability that a randomly selected individual with a negative test really does not have the disease is called the negative predictive value,

Sensitivity and specificity use the disease status to predict the test result, while the PPV and NPV use the test result to predict the disease status. Obviously, these two predictions are correlated.
Simple algebra shows that

If Sp=1, then PPV=1. Otherwise,

The above expression shows that although PPV is a complicated function of the sensitivity and specificity, it only depends on Se/(1-Sp) and is an increasing function of Se/(1-Sp). Similarly,

If Se=1, then NPV=1. Otherwise,

The previous expression shows that although NPV is a complicated function of the sensitivity and specificity, it only depends on Sp/(1-Se) and is an increasing function of Sp/(1-Se).
It is easy to prove that


These three equations imply the equivalence of following four statements:
The test result T and the disease status D are positively correlated.
Se − (1-Sp) ≥ 0.
PPV – p ≥ 0.
NPV - (1-p) ≥ 0.
Statements 3 and 4 indicate that no matter how bad the test is, as long as it is positively correlated with the disease status, the PPV is always greater than the proportion of disease, and the NPV is always greater than the proportion of non-disease in the population. The test result is independent of the disease status if and only if Se − (1-Sp)=0. In this case, PPV=p and NPV=1-p.
Relations between test result and biomarker
In the last two sections we discussed sensitivity, specificity, PPV and NPV for a general test. Now suppose the test result is based on the quantitative value of a biomarker X. For example, the prostate-specific antigen is a biomarker widely used in diagnosing prostate cancer. Different tests may use different biomarkers. The biomarker used in a test is chosen based on clinical or pathological evidence.
The connection of the biomarker to the disease status is specified by the risk function,10 which is defined as,

The risk function R(x) is the probability that the individual has the disease if the value of the biomarker is x. For technical reasons, we make the following assumptions on the biomarker and risk function.
Assumption 1: X is a continuous variable and has a continuous probability distribution function.
Assumption 2: the risk function is strictly increasing so that individuals with a higher value of the biomarker tend to have the disease with a higher probability.
To find the exact form of the risk function, we need to know the joint distribution function of (D, X), which is unknown in practice. Usually we specify some analytic form for it. Since it is the conditional probability of D given X, we may specify a logistic regression model.11
After obtaining the measurement of the biomarker, the test needs to assign the individual to positive or negative based on some prespecified cut-off c. If X > c, the test assigns the individual to positive (T=1). Otherwise, the result is negative (T=0). From the definition of sensitivity and specificity, we can see that


From these two equations, we can see the sensitivity and specificity depend on two factors: (1) the biomarker X and (2) the cut-off c. Usually the biomarker is prespecified; the major consideration is the choice of the cut-off. It is easy to see that the sensitivity (TPR) decreases with the cut-off, and the specificity increases with the cut-off. Remember that 1-Sp is the FPR. This means that both TPR and FNR are decreasing functions of the cut-off. Therefore, Se(c) and 1-Sp(c) change in the same direction.
Monotone relations between predictive values, sensitivity and specificity
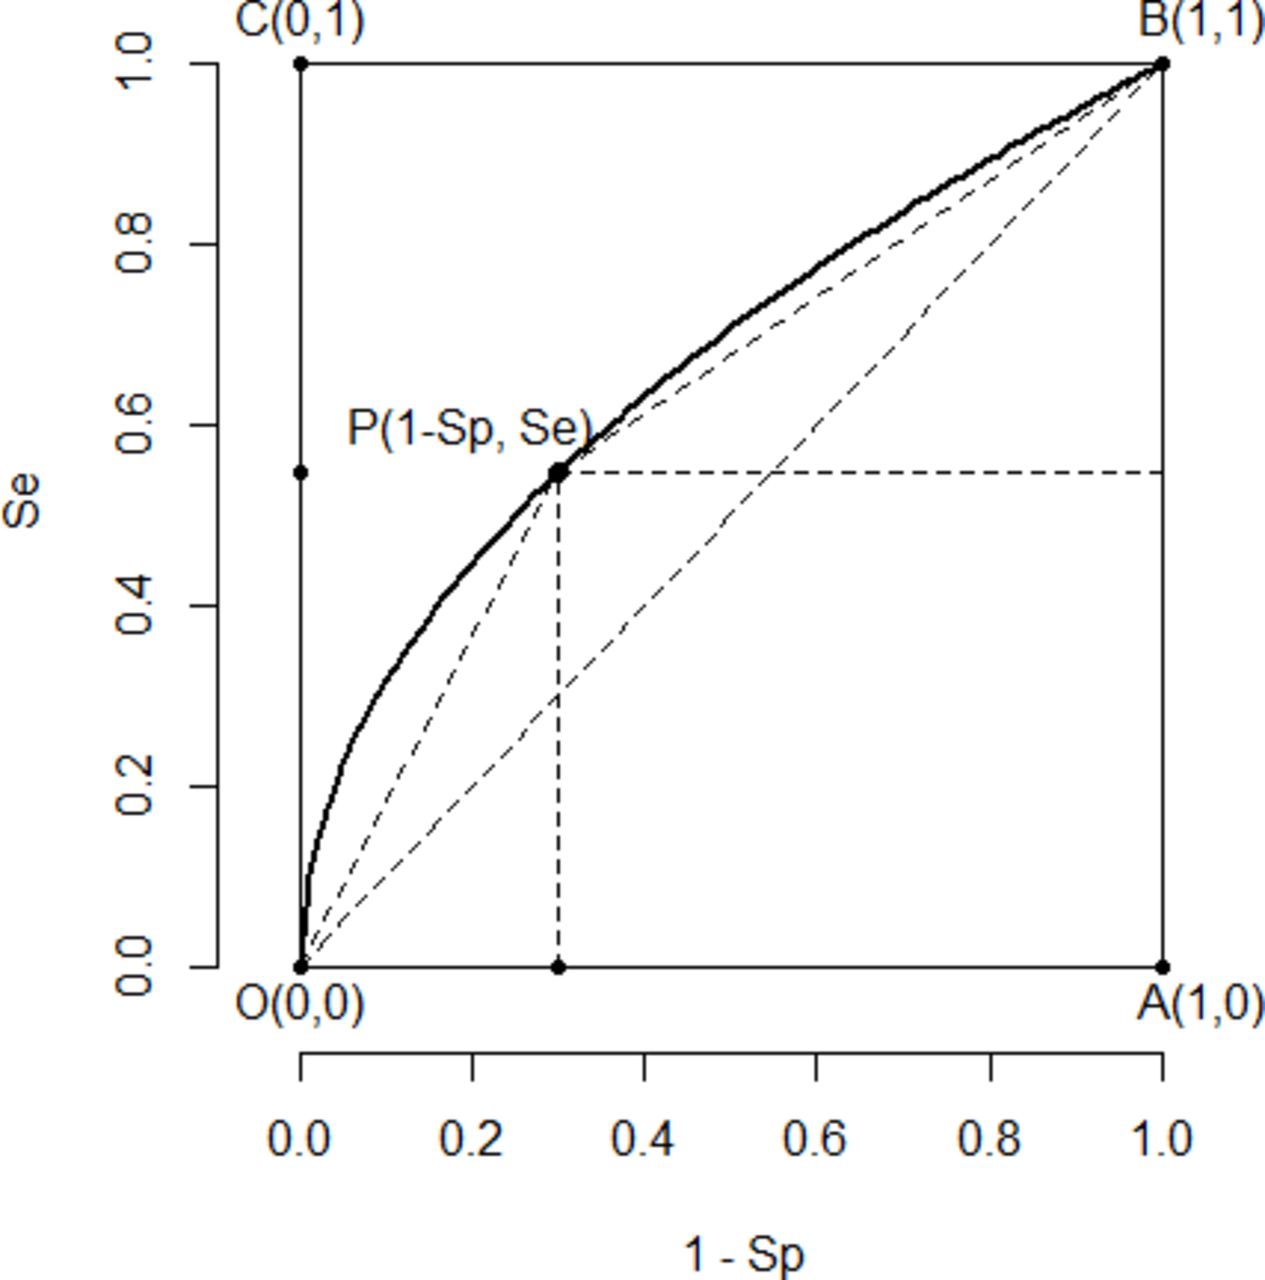
As discussed in the last section, if we let the cut-off c change in the range of X, the plot of Se(c) versus 1-Sp(c) is a curve within the unit square with two endpoints (0,0) and (1,1). This curve is called the receiver operating characteristic (ROC) curve of the test. Figure 1 is a typical ROC curve.
A typical ROC curve. ROC, receiver operating characteristic.
The ROC has been widely used in medical, engineering, finance and many other areas. Some properties of the ROC have been discussed extensively in the literature. Many papers and books have been published on ROC curve. Here we state two results. The proof of them can be found in a technical paper.12
Theorem 1 . Under the assumptions 1 and 2, the ROC curve is concave (or upside-down U).
From the property of convex function, we know that under those two assumptions, the ROC curve is always above line segment OB, which means that Se − (1-Sp)≥0. From the end of the last section, this implies that the test result is always positively correlated with the disease status, PPV ≥p and NPV ≥1-p.
Figure 1 shows the graph of a typical ROC curve OPB. Each ROC curve has two special points: O=(0, 0), where the sensitivity is 0 and the specificity is 1 and the test assigns all individuals to negative; and B=(1, 1), where the specificity is 0 and the sensitivity is 1 and the test assigns all individuals to positive. There are two other extreme points usually not on the ROC curve but are of interest, A=(1, 0), where Sp=0, and Se=0 and the test does not offer any information about the disease; and C=(0, 1), where Sp=Se=1 and the test is perfect (usually not achievable in practice). All reasonable test results are points on the ROC curve strictly between O and B.
The predictive values are closely connected to the ROC curve. The slope of OP is Se/(1-Sp) and the slope of PB is (1-Se)/Sp. Since the ROC curve is concave, as point P moves from O to B, Se increases, Sp decreases and both slopes of OP and PB decrease. This fact can be rigorously proved using the property of concave functions.12 We have the following
Theorem 2. Under the assumptions 1 and 2, PPV decreases with the sensitivity, and the NPV decreases with Sp.
We summarise the relations among sensitivity, specificity, the PPV and the negative predictive in table 1. The ‘+’ sign means two quantities change in the same direction, where ‘−’ sign means they change in opposite directions.
Relations among Se, Sp, PPV and NPV
Numerical study
In this section, we use some numerical examples to show how these four quantities change. Note that given a cut-off c of the biomarker, sensitivity, specificity, positive and negative predictive value are all functions of c from which we can identify the changing pattern of each pair of them.
For simplicity, assume the biomarker X has a standard normal distribution. The risk function is assumed to be of the form of the logistic function

From the probability theory, we know that the expected value of the risk function should equal the proportion p of the disease. Given each p, we determine unique parameter β0 in the risk function by numerical integration. For example, p=0.1, β0=−2.5642; p=0.2, β0=−1.5601; and p=0.3, β0=−1.0187.
Table 2 shows values of Se(c), Sp(c), PPV(c) and NPV(c) for c=−2.5,–2.0, −1.0, 0, 1, 2 and 3. We can see that Se and NPV are increasing functions of c, while Sp and PPV are decreasing functions of c. They are consistent with our conclusion developed above.
Numerical results from simulations
Conclusion
In this paper, we studied the relations among sensitivity, specificity, PPV and NPV. We assume the test result is based on the value of a biomarker, and the risk of the disease (the conditional probability of the disease given the biomarker) is a strictly increasing function of the biomarker. Under these assumptions, we find that: (1) the ROC curve is concave, (2) sensitivity and specificity change in opposite directions, (3) PPV and sensitivity change in opposite directions and (4) NPV and specificity change in opposite directions. The last two conclusions are a little bit counterintuitive.
As discussed in section 3, the PPV is 1 if and only if no non-diseased individuals can be assigned to positive. This does exclude the case that some diseased individuals may be assigned to negative. PPV <1 if and only FPR >0. Under assumptions in section 4, the ROC curve is concave. When the sensitivity increases, the FPR increases at a faster rate than the sensitivity, which makes Se/FPR and PPV decrease. Increasing the sensitivity has the risk of increasing the false positive rate, which hurts the PPV of the test. Similarly, increasing the specificity may hurt the negative value of the test. We should be careful if the sensitivity of a test is reported to be very high as it may be too good to be true. There exists a tradeoff between the sensitivity and the PPV unless the test is perfect.
References
Hongyue Wang obtained her BS in Scientific English from the University of Science and Technology of China (USTC) in 1995, and PhD in Statistics from the University of Rochester in 2007. She is a Research Associate Professor in the Department of Biostatistics and Computational Biology at the University of Rochester Medical Center. Her research interests include longitudinal data analysis, missing data, survival data analysis, and design and analysis of clinical trials. She has extensive and successful collaboration with investigators from various areas, including Infectious Disease, Nephrology, Neonatology, Cardiology, Neurodevelopmental and Behavioral Science, Radiation Oncology, Pediatric Surgery, and Dentistry. She has published more than 90 statistical methodology and collaborative research papers in peer-reviewed journals.

Footnotes
Contributors CF and HW derived the theoretical results; BW and XZ constructed the examples and graphs.
Funding The authors have not declared a specific grant for this research from any funding agency in the public, commercial or not-for-profit sectors.
Competing interests None declared.
Patient consent for publication Not required.
Provenance and peer review Commissioned; externally peer reviewed.
Data availability statement There are no data in this work.