Article Text

Abstract
Background With an aggravated social ageing level, the number of patients with Alzheimer’s disease (AD) is gradually increasing, and mild cognitive impairment (MCI) is considered to be an early form of Alzheimer’s disease. How to distinguish diseases in the early stage for the purposes of early diagnosis and treatment is an important topic.
Aims The purpose of our study was to investigate the differences in brain cortical thickness and surface area among elderly patients with AD, elderly patients with amnestic MCI (aMCI) and normal controls (NC).
Methods 20 AD patients, 21 aMCIs and 25 NC were recruited in the study. FreeSurfer software was used to calculate cortical thickness and surface area among groups.
Results The patients with AD had less cortical thickness both in the left and right hemisphere in 17 of the 36 brain regions examined than the patients with aMCI or NC. The patients with AD also had smaller cerebral surface area both in the left and right hemisphere in 3 of the 36 brain regions examined than the patients with aMCI or NC. Compared with the NC, the patients with aMCI only had slight atrophy in the inferior parietal lobe of the left hemisphere, and no significant difference was found.
Conclusion AD, as well as aMCI (to a lesser extent), is associated with reduced cortical thickness and surface area in a few brain regions associated with cognitive impairment. These results suggest that cortical thickness and surface area could be used for early detection of AD.
- alzheimer’s disease
- amnestic mild cognitive impairment
- cortical thickness
- surface area
This is an open access article distributed in accordance with the Creative Commons Attribution Non Commercial (CC BY-NC 4.0) license, which permits others to distribute, remix, adapt, build upon this work non-commercially, and license their derivative works on different terms, provided the original work is properly cited, appropriate credit is given, any changes made indicated, and the use is non-commercial. See: http://creativecommons.org/licenses/by-nc/4.0/.
Statistics from Altmetric.com
Introduction
Alzheimer’s disease (AD), the most common form of dementia, accounts for 50%–60% of all cases. It is a progressive, irreversible and currently incurable neurodegenerative disease.1 2 The main clinical manifestations are continuous degeneration of cognitive function, comprehension, judgement, memory and self-control, even total loss occurs. Dramatic loss of cortical neurons in AD results in severe atrophy of the cerebral grey matter, causing progressive decline in cognition and brain function. Mild cognitive impairment (MCI), a potential precursor to or early form of AD, has the same aetiology, but to a lesser degree.3 Approximately 10 to 15% of patients with MCI experience progression to AD.4 5 Amnestic MCI (aMCI), a subtype of MCI, is characterised by primary memory deficits, and patients with aMCI have a high risk of progression to AD.6
In the current study, we compared the surface-based measures of cerebral cortical thickness and surface area among patients with AD, patients with aMCI and normal elderly controls. The brain is composed of grey matter and white matter. Cortical thickness is defined as the distance from the interface between cerebrospinal fluid and grey matter to the interface between the white matter cortex and the grey matter cortex.7 Compared with normal elderly individuals, elderly patients with MCI have been shown to have significantly reduced cortical thickness, mainly in the hippocampus, parahippocampal gyrus, temporal lobe, fusiform gyrus, posterior cingulate, and other areas, and these abnormalities are even more pronounced in elderly patients with AD.8–10 Surface area is the average area of the triangles that touch the vertex on the pial surface.11 The complexity of the folding of the sulci, which are numerous in the cerebral cortex, affects the size of the surface area.
Although previous studies have uncovered abnormal development of brain structures in AD, results pertaining to the relationship between memory deficits and grey matter volume in patients with AD and MCI have not been consistent.12 On the basis of previous findings of widespread abnormalities in brain structure in AD, we expected to find significant alterations in cortical thickness and surface area in patients with AD and aMCI.
Materials and methods
Participants
All volunteers and their legal guardians involved gave informed consent. Eligible patients recruited here are patients with AD who met the criteria of dementia according to the Diagnostic and Statistical Manual of Mental Disorders, and aMCI was diagnosed based on the previously published criteria.12 Age-matched and sex-matched normal control (NC) subjects were also enrolled. Before enrolment, patients were asked to provide their medical history and perform physical and neurological examinations, laboratory tests and T1-weighted MRI scans. Patients with AD whose course of disease was more than 2 years without treatment and patients with aMCI without treatment in the disease course for more than 1 year were chosen. Patients with any of the following were excluded: a neurological disorder, any physical illness (such as hepatitis, brain tumour, trauma or epilepsy) or a history of major depression, bipolar disorder, schizophrenia and substance abuse or dependence in the previous 180 days. The control subjects did not have any cognitive complaints or functional impairments.13
In order to accommodate the low education level of the elder Chinese, we amended the aMCI diagnostic criteria of the Petersen Mini Mental States Examination (MMSE)14 and evaluated the cognitive status of each participant. The scores <24 indicated AD, scores ranging from 24 to 26 indicated aMCI and scores >26 were considered normal. All scores were consistent with the patient’s diagnosis.
MR image acquisition
MRI was used for scanning participants using a Siemens MAGNETOM VERIO 3T scanner (Munich) at Shanghai Mental Health Center. T1-weighted images were obtained with 128 sagittal slices using the three-dimensional magnetisation-prepared rapid acquisition gradient echo sequence with the following parameters: TR=2530 ms, TE=3.39 ms, flip angle=7° and spatial resolution=1×1 x 1.3 mm3, and the acquisition time was 8 min 7 s. Images were reviewed and discarded, if there were any pathological findings.
Image processing
All MRI studies were processed on the same workstation using FreeSurfer V.5.3. Cortical surface reconstruction was performed to calculate cortical thickness and surface area at each vertex.15 The Automated Anatomical Labelling template is a widely used high-resolution T1-weighted brain parcellation based on a single adult subject.16 FreeSurfer automatically parcelled the cortex into 36 gyral-based regions of interest (ROIs) per hemisphere (figure 1) using several processing steps, including skull stripping, spatial transformation, atlas registration, surface reconstruction, spherical surface mapping and atlas-based regional parcellation. Both grey matter/white matter and grey matter/cerebrospinal fluid surfaces were reconstructed using spatial intensity gradients across tissue classes. The cerebral cortex was then parcelled into regions on the basis of the folding structure of gyri and sulci.16 Cortical thickness was calculated as the shortest distance between the grey matter/white matter surface and the pial surface.17 More technical details of these procedures were described previously.15 18 The results of the automated segmentation, surface reconstruction and parcellation process were manually inspected for all participants.
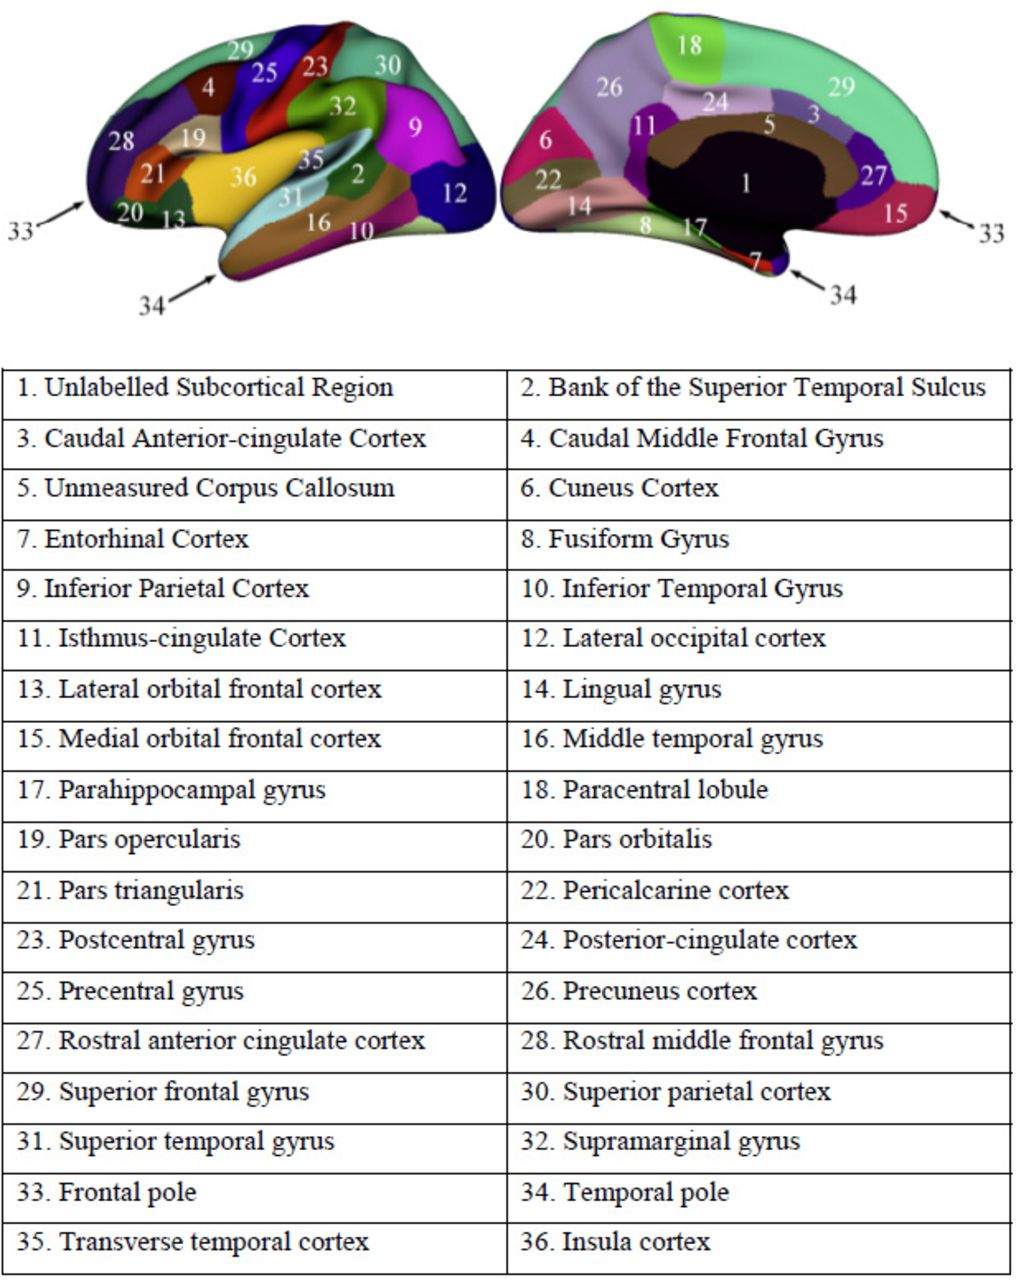
Regions of interest in the left hemisphere.
Statistical analyses
Cortical thickness and surface area maps were smoothed using a 20 mm Gaussian kernel.19 Then, variance analysis was applied to the measures of cortical thickness and surface area to determine whether there were significant differences in brain structure between the patients with AD, aMCI and the control subjects. We used a false discovery rate of 0.05, corrected for multiple comparisons at the vertex level. We also modelled age and the whole brain volume as covariates of no interest to minimise any confounding effects of these variables.
Results
Patient characteristics
The figure 2 shows the flow diagram of the study. We recruited a total of 20 patients with AD, 21 patients with aMCI and 25 age-matched and sex-matched NC. The mean (SD) age for the entire cohort was 71.74 (7.373) years and the mean education level (measured by years completed) was 11.19 (2.83) years. Demographic and clinical data for participants by group are presented in table 1.

Flowchart of the study
Demographic and clinical features of patients with AD, patients with aMCI and normal controls.
Cortical thickness
There was no marked difference of cortical thickness in both left and right hemisphere between patients with aMCI and NC (figure 3A–D).
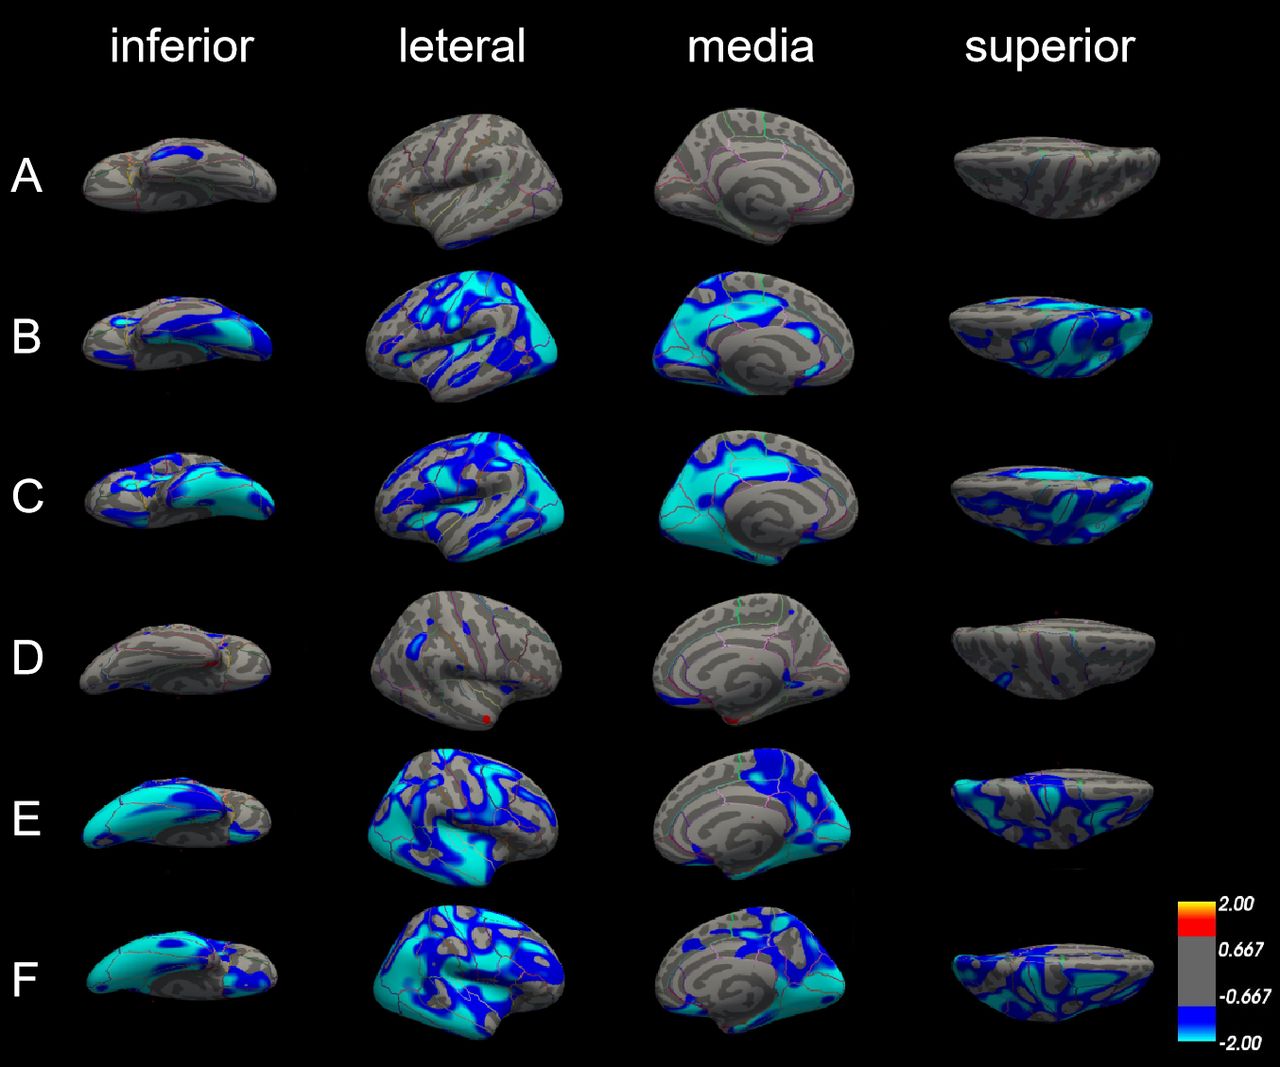
Differences in cortical thickness among patients with Alzheimer’s disease (AD), patients with amnestic mild cognitive impairment (aMCI) and normal controls (NC). The comparison is made from four directions (inferior, lateral, medial and superior) in the left hemisphere (A, B and C) and right hemisphere (D, E and F), respectively. (A) and (D) Cortical thickness did not significantly differ between patients with aMCI and NC in both left and right hemisphere. (B) and (E) The blue areas showed significantly reduced cortical thickness in patients with aMCI compared with NC. (C) and (F) The blue areas showed significantly reduced cortical thickness in patients with AD compared with aMCI.
In the left hemisphere, cortical thickness was significantly reduced in patients with AD compared with NC in 22 areas of the cerebral cortex, including lateral occipital cortex, lingual gyrus, superior parietal cortex, precentral gyrus, inferior parietal cortex, isthmus cingulate cortex, postcentral gyrus, cuneus cortex, pericalcarine cortex, insula cortex, precuneus cortex, supramarginal gyrus, paracentral lobule, pars triangularis, posterior-cingulate cortex, transverse temporal cortex, fusiform gyrus, rostral anterior cingulate cortex, caudal anterior-cingulate cortex, superior temporal gyrus, superior frontal gyrus and caudal middle frontal gyrus. In the right hemisphere, there is no significant difference in cortical thickness in caudal anterior-cingulate cortex, isthmus cingulate, pars triangularis, rostral anterior cingulate cortex, transverse temporal cortex, but in the entorhinal cortex, medial orbitofrontal cortex, middle temporal gyrus, parahippocampal gyrus, the cortical thickness is reduced significantly (figure 3B,E, table 2).
Areas of cortical thickness significantly reduced in patients with Alzheimer’s disease compared with normal controls
Compared with patients with aMCI, cortical thickness was also significantly reduced in patients with AD; the thinner areas were similar as those between patients with AD and NC. The different areas were mainly in the left hemisphere, including pericalcarine cortex, inferior parietal cortex, inferior temporal gyrus, cuneus cortex, precuneus cortex, posterior-cingulate cortex, lateral occipital cortex, postcentral gyrus, insula cortex, parahippocampal gyrus, entorhinal cortex, isthmus-cingulate cortex, lateral orbitofrontal cortex, fusiform gyrus, superior parietal cortex, middle temporal gyrus, pars triangularis, precentral gyrus, paracentral lobule, caudal middle frontal gyrus, and lingual gyrus. But in the areas such as lateral orbitofrontal cortex, paracentral lobule, pars triangularis, posterior-cingulate cortex and superior parietal cortex only can find reduce in left side, the areas such as medial orbital frontal cortex, superior frontal gyrus and supramarginal gyrus show significantly reduce in the right side (figure 3C,F, table 3).
Areas of cortical thickness significantly reduced in patients with Alzheimer’s disease compared with normal controls
Surface area
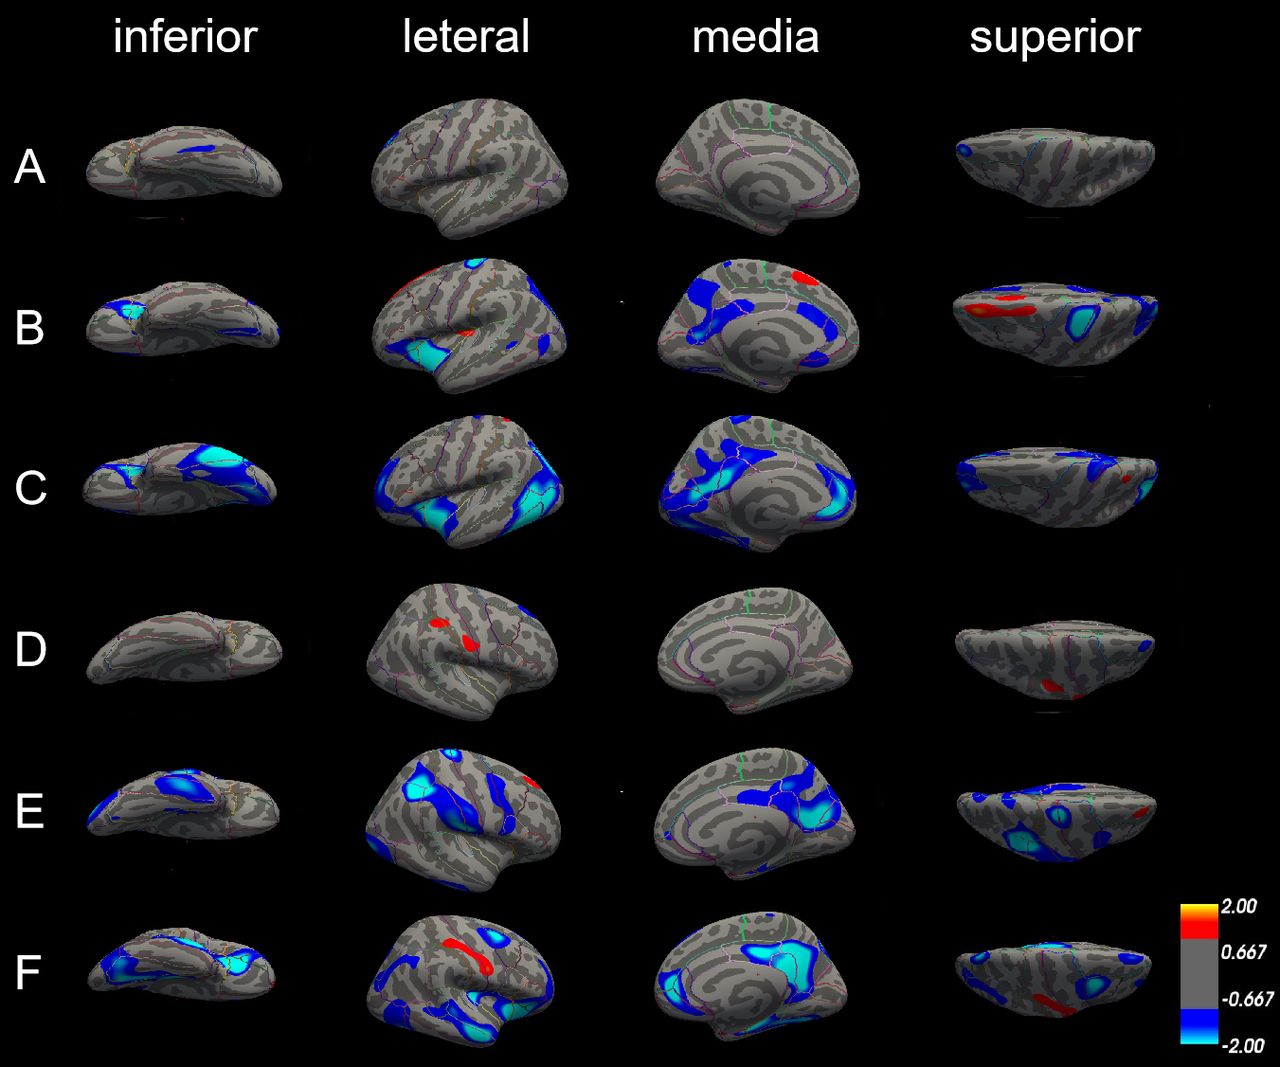
There were no significant differences in the surface area in the left hemisphere between patients with aMCI and NC; only some differences in the lateral occipital cortex of the right hemisphere (figure 4A,D).

Differences in surface area among patients with Alzheimer’s disease (AD), patients with amnestic mild cognitive impairment (aMCI) and normal controls (NC). The comparison is made from four directions (inferior, lateral, medial and superior) in the left hemisphere (A, B and C) and right hemisphere (D, E and F), respectively. (A) and (D) Surface area did not significantly differ between patients with aMCI and NC in both left and right hemisphere. (B) and (E) The blue areas showed significantly reduced surface area in patients with aMCI compared with NC. (C) and (F) The blue areas showed significantly reduced surface area in patients with AD compared with aMCI.
Compared with NC, patients with AD exhibited several significantly smaller cerebral surface areas. Only precentral gyrus and superior parietal cortex were reduced in both left and right hemisphere; surface areas of insula cortex, lateral orbitofrontal cortex and pars triangularis were only reduced in the left hemisphere, and surface areas of cuneus cortex, inferior parietal cortex, postcentral gyrus, precentral gyrus, and supramarginal gyrus were only reduced in the right hemisphere (figure 4B,E, table 4).
Areas of cortical thickness significantly reduced in patients with Alzheimer’s disease compared with normal controls
Differences in the surface area between patients with AD and with aMCI in the left and right hemisphere were also similar. The left and right hemispheres have several areas of common reduction, such as fusiform gyrus, insula cortex, isthmus-cingulate cortex, middle temporal gyrus, precuneus cortex, superior parietal cortex, and they also have smaller surface areas that belong to their own parts. The surface area of inferior parietal cortex, inferior temporal gyrus, lateral occipital cortex, pars triangularis, pericalcarine cortex and rostral anterior cingulate cortex was significantly reduced in the left hemisphere; however, the surface area of caudal middle frontal gyrus, lateral orbitofrontal cortex, medial orbital frontal cortex, parahippocampal gyrus, posterior-cingulate cortex and superior frontal gyrus was reduced in the right side (figure 4C,F, table 5).
Areas of cortical thickness significantly reduced in patients with Alzheimer’s disease compared with amnestic mild cognitive impairment
Discussion
Main findings
In the current study, the main goal was to investigate changes in cortical anatomy, specifically cortical thickness and surface area, in patients with AD and aMCI compared with NC. As predicted, compared with patients with aMCI and NC, patients with AD had significant cortical thickness and surface area atrophy in a wide regions of the frontal, temporal and occipital lobes of the brain. In addition, we found that patients with aMCI showed atrophy between normal ageing and AD. As aMCI is considered to be the prodromal stage of AD, even in the preclinical phase, our results collectively indicate that the atrophy of cortical thickness and surface area in aMCI begins in the temporal lobe, but the range of atrophy gradually expands as the disease progresses.
As can be found from our results, the reduction in cortical thickness is mainly concentrated in pericalcarine cortex, supramarginal gyrus, cuneus cortex, lateral occipital cortex, precuneus cortex, paracentral lobule, fusiform gyrus, superior frontal gyrus, lateral occipital cortex, entorhinal cortex, inferior parietal cortex, isthmus-cingulate cortex, postcentral gyrus, superior parietal cotex, caudal middle frontal gyrus, insula cortex and precentral gyrus. We found the pars triangularis was the only region that showed significant reduction in cortical thickness in the left hemisphere. The pars triangularis is part of the inferior frontal gyrus and is also known as Brodmann area (BA) 45. Together with BA44, BA45 comprises Broca’s area, a region with functions linked to speech production, such as semantic decision tasks and generation tasks. In the linguistic information processing, it has been proven that there is a left hemisphere dominant in Broca area.20 The lesions of BA45 cause the characteristic manifestations of aphasia in left hemisphere dominant individuals. The vast majority of right-handed adults often suffer from cerebral cortex injuries on the left side of the brain. The BA44 area lesion in the right hemisphere did not show significant impairment of language activity. However, the injury to the Broca area of the left hemisphere resulted in severe aphasia. Brain lateralisation refers to the structural and functional asymmetry of the left and right hemispheres of the brain. Usually, the language function shows an obvious left hemisphere dominance,21 while cognitive control shows the right hemisphere dominance.22 Liu and colleagues investigated the topological properties of the whole brain networks by using functional MRI in patients with AD, patients with MCI and age-matched healthy subjects. Compared with NC, patients with MCI showed decreased nodal centrality mainly in the right pars triangularis, right superior parietal cortex and left hippocampus.23 The result in our study showed that compared with NC, aMCI cortical thickness was not significantly reduced at the pars triangularis, whereas the cortex thickness of the left pars triangularis was significantly atrophied in AD compared with aMCI and NC. Consider that language production has not been significantly affected in the early stages of cognitive decline. With the gradual decline of cognitive function, the language production function begins to be significantly impaired, which is consistent with the clinical performance of patients with MCI and AD. In addition, medial orbital frontal cortex and middle temporal gyrus showed that significant cortex thickness reduction only existed on the right hemisphere. The most important area of the brain related to memory is the medial temporal lobe, including the hippocampus and entorhinal cortex.24
Another result in our study was that compared with aMCI and NC, respectively, the precuneus cortex, insula cortex and superior parietal cotex of AD showed significant difference in surface area. The precuneus cortex is a part of the superior parietal lobule on the medial surface, forward of the cuneus. It contains three subdivisions: the sensorimotor anterior region, cognitive/associative central region and visual posterior region. It participates in various processes such as episodic memory, visual space processing, self-reflection and consciousness.25 The forward part of the precuneus is related to the mental imagery concerning the self, and the posterior areas are involved with episodic memory.26 It is associated with the left prefrontal cortex and involved with the recall of episodic memory, including past self-related episodes.27 28 In addition, we found that consistent with the reduction in cortical thickness, the pars triangularis of the patients with AD also had a significant reduction in cortical surface area in the left cerebral hemisphere, with the medial orbital frontal cortex and middle temporal gyrus decreasing in the right cerebral hemisphere.
Several studies have suggested that the grey matter atrophy in AD is asymmetric between the left and right hemispheres and that it is more serious on the left side than on the right. However, this asymmetry is controversial.29 30 Another study found that atrophy of the left and right hemispheres of the cerebral cortex in patients with mild AD presented to be basically symmetrical, but the atrophy of the left posterior parietal lobe and dorsolateral cortex was more severe than that of the right side.8 Our results were similar to those, compared with the NC group, the cortical thickness and surface area in the right hemisphere of patients with aMCI had no significant difference; only a slight atrophy in the lateral parietal lobe of the left hemisphere, but did not reach significant difference. The surface area and cortical thickness of the left hemisphere of the patients with AD were significantly lower than the patients with aMCI. Although the left and right sides of AD had slight differences in atrophy, the atrophy aeras were similar. Therefore, we can conclude that the asymmetry of the atrophy between the left and right hemisphere becomes less pronounced with the development of AD, and the atrophy diffused into the whole brain.
As mentioned above, our study showed that patients with AD have been shown to have areas of atrophy throughout the brain, and the atrophy is concentrated in areas related to learning, memory, language understanding, information integration and other cognitive functions.31 Our study also showed that both cortical thickness and surface area were markedly reduced in the prefrontal lobe and lateral occipital cortex in patients with AD, suggesting that these are consistent areas of atrophy in AD. Our results also suggest that cortical thickness and surface area can detect how the brain changes during the process of cognitive ageing. Atrophy in MCI subjects was spatially more restricted than in AD but occurred at similar locations. Thus, our findings suggest that cortical thickness and surface area may be a sensitive measure for characterising grey matter atrophy in the early stages of AD, which may help with early detection of the disease.
Limitations
First, the sample size was not big enough; we will increase the number of patients analysed in follow-up studies so that more differences can be examined among the groups. Second, traditional measurement methods of ROI have some limitations. The choice of ROI is based on the researchers’ existing experience, and the positioning of ROI is somewhat subjective among researchers. Therefore, the specific ROI should be reviewed in any comparisons to other studies. Finally, the current study was based on findings from only one MRI study per patient at a specific stage of the disease. Although our use of multiple patient groups allowed for general comparison over the course of disease progression, further research should take a more longitudinal approach to gain more insight into how structural changes relate to cognitive status over time within the same patients. In future studies, we also plan to further subdivide patients with AD on the basis of cognitive status. We will explore this topic further in the future.
Implications
In summary, we performed a systematic study on cortical thickness and surface area among the three groups: the AD group, the aMCI group and the NC group. Therefore, we found that the reduction of cortical thickness and surface area are associated with the development of AD, and could be used for early detection of AD.
References
Huanqing Yang graduated from Qiqihar Medical University in 2010 with a bachelor's degree of psychiatry. Now, she is studying for the postgraduate degree in the Shanghai Mental Health Center, Shanghai Jiao Tong University School of Medicine. Her main research areas are the clinical characteristics and the pathogenesis of neurocognitive disorder.

Footnotes
HY, HX and QL are joint first authors.
HY, HX and QL contributed equally.
Correction notice This article has been corrected since it was published Online First. This article was originally published without the correct Open Access licence.
Contributors HY and HX drafted the paper. HY and QL made the statistical analysis. YJ, WJ, JW, YW, WL and CY carried out the data collection. XL double-checked the data. SX designed and was responsible for the study. TW carried out the research, while TW and FS supervised the data collection, statistical analysis and modified the paper. HY, HX and QL contributed equally to this work as co-first authors.
Funding TW was supported by the Collaborative Innovation Center for Translational Medicine at Shanghai Jiao Tong University School of Medicine TM201728, National Nature Science Foundation of China 81571298, Shanghai health system excellent talent training program (excellent subject leader) project 2017BR054, Shanghai Municipal Education Commission-Gaofeng Clinical Medicine Grant Support 20172029, Shanghai Pujiang Program 17PJD038.
Competing interests None declared.
Patient consent for publication Obtained.
Ethics approval This study was approved by the Ethical Committee of Shanghai Mental Health Center.
Provenance and peer review Not commissioned; externally peer reviewed.
Data sharing statement No additional data are available.