Article Text

Abstract
Background The corpus callosum (CC) is the most targeted region in the cerebrum that integrates cognitive data between homologous areas in the right and left hemispheres.
Aims Our study used statistical analysis to determine whether there was a correlation between shape changes in the CC in patients with schizophrenia (SZ) (deficit syndrome (DS) and non-deficit syndrome (NDS)) and healthy control (HC) subjects.
Methods This study consisted of 27 HC subjects and 50 schizophrenic patients (20 with DS and 30 with NDS). 3 patients with DS and 4 patients with NDS were excluded. Three-dimensional, sagittal, T1-spoiled, gradient-echo imaging was used. Standard anatomical landmarks were selected and marked on each image using specific software.
Results As to comparing the Procrustes mean shapes of the CC, statistically significant differences were observed between HC and SZ (DS+NDS) (p=0.017, James’s Fj=73.732), HC and DS (p<0.001, James’s Fj=140.843), HC and NDS (p=0.006, James’s Fj=89.178) and also DS and NDS (p<0.001, James’s Fj=152.967). Shape variability in the form of CC was 0.131, 0.085, 0.082 and 0.086 in the HC, SZ (DS+NDS), DS and NDS groups, respectively.
Conclusions This study reveals callosal shape variations in patients with SZ and their DS and NDS subgroups that take into account the CC’s topographic distribution.
- schizophrenia
- psychiatry
- neuropsychiatry
- biostatistics
Data availability statement
Data are available upon reasonable request.
This is an open access article distributed in accordance with the Creative Commons Attribution Non Commercial (CC BY-NC 4.0) license, which permits others to distribute, remix, adapt, build upon this work non-commercially, and license their derivative works on different terms, provided the original work is properly cited, appropriate credit is given, any changes made indicated, and the use is non-commercial. See: http://creativecommons.org/licenses/by-nc/4.0/.
Statistics from Altmetric.com
Introduction
Schizophrenia is a severe psychiatric disease with significant social consequences and has been the subject of decades of neuroimaging study, yet little is known about its neurobiology.1 Genetic and histopathological investigations have shown a connection between white matter (WM) genetic variations and genes associated with the risk of schizophrenia.2 3 Schizophrenia symptoms are thought to be the result of a disruption of the interhemispheric communication.4 WM investigations using MRI have supported the interruption theory, showing that the corpus callosum (CC) of patients with schizophrenia (including first-episode schizophrenia) is substantially smaller than that of healthy controls (HC).5–7 Despite significant discrepancies in the findings, many investigations using a variety of imaging methods have revealed important details regarding the pathophysiology of schizophrenia. The advent of MRI aided in the identification of the neuroanatomical origins of schizophrenic illness.8 Nonetheless, the disease’s heterogeneity and the categorisation of all subjects with a diagnosis of ‘schizophrenia’ have most likely served as a barrier to this invention. Some neuroimaging studies have been aimed at clinical subtypes of schizophrenia.9 10 Extensive neuroanatomical, neurobiological and neuropsychological studies have been conducted to delineate possible subgroups of diverse groups of schizophrenia characterised by symptom domain predominance. Carpenter et al11 used the term ‘deficit syndrome’ (DS) to refer to the presence of main and persistent negative symptoms (a deficit in goal-directed or pleasurable behaviour, voice and non-verbal expression). In patients with DS, impaired cognition, longer course, poorer functional outcomes, lower life quality, and compromised educational and professional activity have all been identified.12 13 In a diverse population of patients with schizophrenia, the prevalence of DS is about 15% in first-episode psychosis and 25%–30% overall.14 Numerous investigations with limited sample sizes and participant numbers tried to scan the neurostructure of patients with DS and compared the results with those obtained from non-deficit syndrome (NDS) imaging studies.15 They found that individuals with DS exhibited lower fractional anisotropy (FA) values in many brain regions compared with those with NDS. This may imply a larger dissociation of the WM in DS.9 16–20 Voineskos et al17 found that individuals with first-episode psychosis who also have clinical indications of DS had a greater impairment in the WM tract. This demonstrates that disruptions of the interhemispheric communication may contribute to the development of clinical symptoms in DS. Disruption of WM in the superior longitudinal fasciculus and the uncinate fasciculus indicates a disconnection between the temporal, parietal and limbic cortices.9 16 Spalletta et al20 and Lei et al18 both found that the FA values decreased in the CC. Meanwhile, it has been shown that the FA values in the CC splenium and the body have reduced.17 19 This indicates that comprehending the psychopathology of DS requires a thorough knowledge of the brain’s interhemispheric regions.
Although callosal fibres extend extensively into each cerebral hemisphere, the callosal mid-sagittal border of the cross section has received the greatest attention, both because of the documented correlations between fibre number and callosal area and because it is easier to identify, depict and analyse.21 The location of the WM impairment may have psychopathological implications; therefore, we chose to concentrate on determining whether geometric morphometric disturbances in particular areas of the CC may be implicated in the pathophysiology of DS.
Geometric morphometrics is a term that refers to applications of statistical shape analysis based on landmarks.22 Geometric morphometrics is a relatively new paradigm for quantitatively analysing the variability and covariance of the forms of biological things.23 24 Coordinate-based techniques are also known as geometric morphometrics because they preserve all geometric information throughout the data gathering, processing and visualisation processes.25
Statistical shape or image analysis, which is used to evaluate two-dimensional or three-dimensional shape data, is gaining increasing popularity in medicine and biology. The principal cause of the increasing use of statistical shape analysis in medicine is technological advances in imaging and a desire to understand the impact of illnesses and environmental variables on organ or organism structure.25
To our knowledge, this is the first study to investigate the topographic distribution of the CC in patients with schizophrenia using cranial MRI in order to discover whether the form of the CC varies between schizophrenia and its subgroups (DS and NDS) as well as between HCs.
Materials and methods
Subjects
We recruited 27 HC and 50 patients with schizophrenia who were classified as either DS (n=20) or NDS (n=30) schizophrenia. Patients diagnosed with schizophrenia were enrolled from Çorlu State Hospital and Tekirdağ Namık Kemal University Education and Research Hospital in Turkey. One patient with NDS was unable to finish the imaging test, and the images of 6 patients (3 NDS and 3 DS) had significant artifacts. Thereby, 27 HC, 17 DS and 26 NDS were included in the study (figure 1).

Flowchart for enrolment. 3D, three-dimensional; DS, deficit syndrome; HC, healthy controls; MRI, magnetic resonance imaging; NDS, non-deficit syndrome; SZ, schizophrenia.
The fourth edition of the Diagnostic and Statistical Manual of Mental Disorders (DSM-IV) was used to diagnose schizophrenia. DS was diagnosed using conventional criteria using the Schedule for the Deficit Syndrome, a semistructured interview.26 The Turkish version of the Positive and Negative Syndrome Scale (PANSS) was the semistructured interview scale used in this research. The Cronbach’s alpha values for the positive syndrome, negative syndrome and overall psychopathology subscales were 0.75, 0.77 and 0.71 on the Turkish version of the PANSS, respectively. As with the original, the Turkish version of the PANSS demonstrated a good level of internal consistency, construct validity and inter-rater reliability. The authors concluded that this adaption is valid and reliable in assessing positive and negative symptoms, as well as general psychopathology, in the Turkish group of patients with schizophrenia.27 28 All patients with schizophrenia were using at least one antipsychotic medication. All HC participants were tested for a current or lifetime history of DSM-IV disorders using the structured clinical interview for DSM-IV non-patient edition (SCID-NP).29 They were also examined to verify that none of their first-degree relatives had ever had psychosis. The study included individuals between the ages of 22 and 68 who met these precise criteria for DS or NDS and were MRI-suitable. Additionally, an HC group of comparable ages and genders was included. Subjects were excluded if they had any of the following criteria: (1) lifelong drug dependence (except psychotic drugs), (2) recent history of drug or alcohol abuse, (3) severe brain injury with loss of consciousness, (4) any significant medical condition or neurological disorder (except schizophrenia) in the schizophrenia (SZ) group, (5) any additional psychological disability or mental retardation or (6) dementia or cognitive impairment according to the DSM-IV.
Acquisition of images
MRI scans were performed using a GE Brivo 1.5 Tesla machine (General Electric, Milwaukee, Wisconsin, USA) with an eight-channel, sensitivity-encoding head coil. On patients undergoing standard MRI, we conducted inversion recovery in sagittal three-dimensional T1-weighted imaging (field of view (FOV), 240 mm×240 mm; matrix, 256 ×256 ; segment thickness, 1 mm; Repetition Time (TR) /Time to Echo (TE), 12.2 ms/5.1 ms; flip angle, 15°). Each individual was subjected to the same imaging technique.
Two-dimensional landmark collection
A single radiologist used TpsDig V.2.30 software to identify and mark the anatomical landmarks. On the CC, 16 anatomical landmarks were described. The 16 landmarks chosen for the CC are as stated in the Sigirli et al30 report. Figure 2 shows the landmarks used for the CC on an MRI of a subject.

The corpus callosum landmarks are visible on this mid-sagittal slice.
Statistical analysis
The Shapiro-Wilk test was used to determine if the variables were compatible with a normal distribution. In the case of a normal distribution, t test was used to compare the groups and mean (SD) was used as descriptive values. If normal distribution was not provided, comparisons were made using Mann-Whitney U test, with descriptive values given as median (minimum–maximum). Categorical variables are denoted by n (%). Pearson’s χ2 test was used to compare categorical variables between groups.
For the comparison of shape, Procrustes analysis was used. Box’s M test was used to determine if the covariance–variance matrices were homogenous. When the matrices of variance and covariance were homogenous, the Hotelling T2 test was used to compare Procrustes mean shapes, whereas James’s Fj test was used when the matrices of variance and covariance were not homogenous. To get an overall assessment of shape variability, the root mean square of Kendall’s Riemannian distance r to the mean shape was employed.
Thin-plate spline (TPS) analysis was used to evaluate the shape deformations. The Procrustes mean shapes were generated for TPS analysis. The regions with the largest reductions or enlargements were colour-coded to indicate deformations based on the findings of the TPS analysis. R V.3.6.3 (‘shapes’), PAST V.2.17 and SPSS V.22 applications were used for statistical analysis in this report. The significance level was established as α=0.05.
Landmark reliability
We used the generalisability theorem (GT) to determine the intrarater reliability coefficient (G, 0≤G≤1) for a two-facet crossing configuration (landmark pairs-by-rater-by-subject).31 The GT employs the generalisability coefficient to quantify the dependability of relative (norm-referenced) interpretations.32 A single rater recognised the anatomical landmarks in this study. The reliability of the rater was determined by repeated landmarks on groups. A single investigator gathered landmarks on the CC and then re-marked the same locations on the same 20 participants after a month (10 cases and 10 HCs). The rating indicated high degree of repeatability for patients (G=0.997 9), controls (G=0.996 1) and overall (G=0.998 4). A landmark reliability account was created31 at http://biostat.home.uludag.edu.tr/landmark_reliability/G_coefficient.html.
Results
Clinical characteristics
There were no statistically significant differences in age or gender between the HC and patient (DS+NDS) groups or between the DS and NDS groups (table 1).
Demographics of the study groups
In DS, Mini-Mental State Exam (MMSE), PANSS positive, PANSS negative, schizophrenia onset age and diagnosis time were 24.53 (2.90), 11 (6–47), 77 (19–108), 20 (14–36) and 13.11 (9.93), respectively.
In NDS, MMSE, PANSS positive, PANSS negative, schizophrenia onset age and diagnosis time were 25.32 (2.87), 25 (2–104), 21 (0–101), 22 (15–59) and 13.05 (10.99), respectively.
Statistical shape analysis
According to the CC shapes, there were statistically significant differences between the HC and SZ (DS+NDS) groups (p=0.017, James’s Fj=73.732), the HC and the DS groups (p<0.001, James’s Fj=140.843) and the HC and the NDS groups (p=0.006, James’s Fj=89.178), as well as between the DS and the NDS groups (p<0.001, James’s Fj=152.967).
The shape variability in the form of the CC in the HC, patient (DS+NDS), DS and NDS groups was 0.131, 0.085, 0.082 and 0.086, respectively. The CC shape variability in the HC group was higher than that of patients and their subgroups. The variability in patients and their subgroups was similar.
According to the CC deformation of the HC group compared with the patient (DS+NDS) group, the area between landmarks 1, 15 and 7 (genu of the CC), the region between landmarks 6 and 11 (on the superior boundary of the region between the posterior body and the isthmus of the CC), and the region between landmarks 2, 4, 5 and 16 (between the isthmus and the splenium of the CC) were found to have the biggest deformation.
With the exception of landmark 16, the greatest deformation observed in HC to patients with DS was identical to that seen in HC to individuals with schizophrenia.
Per the HC group’s CC deformation in comparison with NDS, the greatest deformation was seen between landmarks 1, 15 and 7 (genu of the CC), between landmarks 12 and 13 (between the anterior and posterior bodies of the CC) and between landmarks 2, 3, 4, 5, 11 and 16 (the isthmus and the splenium of the CC).
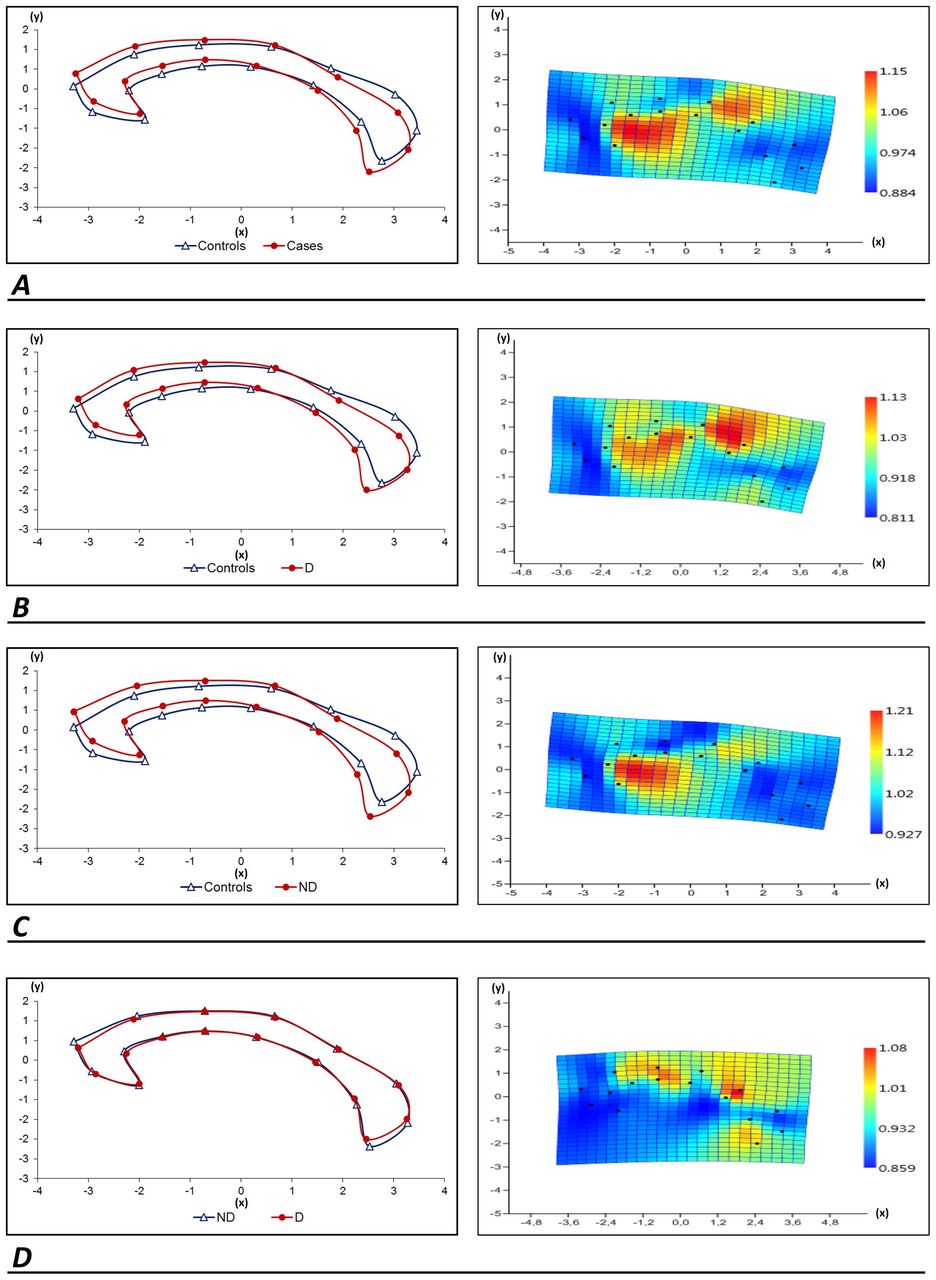
When the shape of the CC was examined from a non-deficit to a deficit state, a high degree of deformation was observed in the regions between landmarks 1, 15, 7 and 8 (rostrum) and in the region between landmarks 4 and 5 (superior zone of the region between the CC’s isthmus and splenium). Furthermore, when comparing DS and NDS with HC using the CC shape analysis, the DS group had greater shape distortion. Graphs are given as two dimensions (abscissa (x) and ordinate (y)) in figure 3. The expansion and contraction factors at the landmarks were numerically displayed in TPS analysis. In TPS charts, the expansion factor was defined as the value is greater than one and the contraction factor was defined as the value is less than one. Deformation areas were interpreted according to the colour scale in the TPS graphs on the right of figure 3.
Left: (A) For the corpus callosum images of HC and SZ, Procrustes mean shapes were used; (B) images of HC and DS; (C) images of HC and NDS and (D) images of NDS and DS. Right: (A) The average corpus callosum shape deformation from HC to SZ as depicted by a thin-plate spline; (B) from HC to DS; (C) from HC to NDS and (D) from NDS to DS. D, deficit; DS, deficit syndrome; HC, healthy control; ND, non-deficit; NDS, non-deficit syndrome; SZ, schizophrenia (DS+NDS).
Discussion
Main findings
Numerous brain imaging investigations have shown abnormal anatomical and functional brain integration in individuals with schizophrenia, corroborating the notion that schizophrenia is a disconnection disease.33 34 Schizophrenia involves interhemispheric connectivity, which raises concerns about the CC’s structural integrity.35 36 The CC is the biggest commissural conduit connecting the two hemispheres of the brain. It comprises an organised bundle of nerve fibres of varying thickness that aggregate to create a mass at the midline and spread to topographically similar areas in either hemisphere. It has been extensively studied in order to determine its involvement in hemispheric communication as well as lateralised brain activity and cognition.
The aim of this research was to look at the shape differences and variations in the CC’s geometric and morphometric form in patients with schizophrenia, as well as the subgroups of DS and NDS. Also, if there are any subregions of these CC variations, they should be evaluated. We used a landmark-based geometric morphometric technique to assess these changes. In comparison with the HC group, the results revealed a significant difference in the CC form in patients with both DS and NDS. Furthermore, subregional analyses revealed that the most noticeable changes were seen in the genu of the CC, on the superior border of the region between the posterior body and the isthmus of the CC, and between the isthmus and the splenium of the CC. According to diffusion tractography-based parcellations of the CC along the mid-section and connectional division of the cortex, these regions are associated with prefrontal, cingulate and superior temporal, respectively.37 In a diffusion tensor imaging (DTI) analysis, Park et al38 discovered that the genu of the CC incorporates bilateral prefrontal cortex in HC. The prefrontal cortex is heavily involved in working memory and processing speed.39 Hypoactivation of the dorsolateral prefrontal cortex has been observed in patients with schizophrenia when performing the n-back exercise.40 Friston41 proposed an irregular functional interaction between the prefrontal and temporal regions in a study of the disconnection theory of schizophrenia. In addition, Kim et al42 looked at grey matter microstructural defects and working memory deficits in people with schizophrenia and found that the schizophrenia group had significantly higher axial diffusivity (AD), radial diffusivity (RD), and trace (TR) values in various frontal, temporal and anterior cingulate regions than the HC group. Our findings seem to correlate to the fibre tracts of the aforementioned damaged grey matter in both hemispheres, as determined by Catani and Thiebaut de Schotten’s37 callosum parcellations. Additionally, a variety of CC deformities were identified in the DS group, which may be linked to the tracts of the CC that originate from the superior temporal gyrus, based on Catani and Thiebaut de Schotten’s37 CC parcellations and mid-section connectional division, whereas in the NDS group the shape distortion of the CC was seen in non-specific areas associated with the parietal, occipital and temporal regions. In the absence of significant variations between groups in total brain volume or total cranial volume, Fischer et al43 discovered that DS cases were differentiated from NDS and healthy reference groups by smaller superior frontal and superior and middle temporal gyral volumes. As a result, the deformities they observed are not solely due to a reduction in total brain volume, but are specific to certain cortical regions. In a Region of Interest (ROI) analysis, the DS group had lower left temporal lobe volume than the NDS and stable matching groups.44 Decreased grey and white matter signal strength in the superior temporal gyrus in DS compared with a stable reference group has also been found in voxel-based morphometry (VBM) studies.10 45 46 Numerous neurostructural MRI investigations have revealed abnormalities in the temporal lobes in DS, which seems to corroborate our results.
Our HC group’s CC shape variability was higher than that of the patientSZ group and their subgroups, while the variability in SZ group and the variability in their subgroups were comparable, which may indicate a neurodevelopmental abnormality that leads to fewer changes in CC shape in patients with schizophrenia and their deficit and non-deficit subgroups. Tao et al47 discovered a robust callosal thickness reduction in schizophrenia, which they conclude is attributable to a brain maturing abnormality that causes reduced functional cohesion and interhemispheric contact integration. The deficit was limited to the back of the mid-section and was related to the severity of negative symptoms.
Joshi et al21 investigated the effect of sex and age on callosal shape abnormalities and disease-associated genetic liability in schizophrenia and showed both global and local impact of age, sex and biological risk on CC shape variation. Specifically, the research found that individual variations in age, sex and illness status were unrelated to callosal size. Despite smaller levels of variance, callosal morphology was similarly linked to schizophrenia and genetic susceptibility to schizophrenia. They discovered that as people get older, the degree of constriction and arching of the CC increases. Despite the large sample size (218), the cohort was diverse, with just 48 people with a DSM-IV diagnosis of schizophrenia participating in the research, and the general schizophrenia groups were examined without distinguishing DS and NDS subgroups. Our report is the first study to use shape analysis and the geometric morphometric technique to examine patients with schizophrenia and compare the DS and NDS subtypes of schizophrenia directly.
The Sigirli et al30 48 research examined the shape deformation of the CC in patients with restless leg syndrome (RLS) and multiple sclerosis (MS) using the shape analysis technique and found that the most apparent deformation occurred in the posterior mid-body and anterior regions of the CC, respectively. According to connectional division (cortical parcellation based on diffusion tractography), the posterior mid-body region of the CC is linked with motor cortex in RLS, which they hypothesised was owing to myelin insufficiency. Nonetheless, the greatest distortion in the anterior area of the CC in MS patients was owing to the sensitivity to MS damage of the CC’s anterior region. These findings bolster the dependability of shape analysis and the geometric morphometric approach, which is compatible with the existing literature on MRI-based research techniques, such as DTI of the WM tracts and VBM.
Limitations
The limitation of the study could be attributed to its small sample size, particularly in the deficit syndrome group.
Implications
The observed deformations are most pronounced in the genu of the CC, along the superior border of the region between the posterior body and the isthmus of the CC, and between the isthmus and the splenium of the CC, implying that the development of schizophrenia has an effect on the prefrontal and parietotemporal cortices. Furthermore, the superior zone of the CC between the isthmus, splenium and rostrum was damaged in the DS group, which may be explained by DS development affecting the superior temporal cortex and cingulum. These results suggest that we should go beyond symptomatology in schizophrenia and its subtypes and that tractographical studies should be conducted to identify WM pathways of the CC in a connectome study.
Data availability statement
Data are available upon reasonable request.
Ethics statements
Patient consent for publication
Ethics approval
This retrospective study was approved by our internal ethics committee (permission granted/decision no: 2020.15.01.15).
References
Dr Yaşar Türk obtained a medical degree from Tehran's Shahid Beheshti Medical School in Iran in 1995 and his radiology specialty from the Medical School of Istanbul University in Turkey in 2006. He completed a fellowship in neuro-interventional radiology at Zurich University Hospital. From 2017 to 2020, he worked as an assistant professor at the Radiology Department of Tekirdag Namik Kemal University in Turkey. He has been an assistant professor at the Zonguldak Bulent Ecevit University Hospital's Radiology Department in Kozlu, Zonguldak, Turkey, since 2020. He is board-certified in neuroradiology by the European Neuroradiology Board. He is presently doing DTI studies on paediatric Down syndrome and paediatric obesity as part of his resident thesis programme.

Footnotes
Contributors YT is responsible for the overall content as the guarantor and had complete access to all of the data in the study and also is solely responsible for the integrity of the data and the correctness of the data analysis. YT, IE, IS, BEG and AU contributed to the concept and design. YT, CÖ, EB and YA were responsible for data collection, analysis and interpretation. YT, IE, IS, BEG and AU drafted the manuscript.
Funding The authors have not declared a specific grant for this research from any funding agency in the public, commercial or not-for-profit sectors.
Competing interests None declared.
Provenance and peer review Not commissioned; externally peer reviewed.